01Two perspectives on the same event
An earnings call records who participates and how the discussion develops. The two factors turn these observations into separate inputs for equity research.
- ECPND: Earnings call participation network and dynamics, measured through external participation and eligible historical connections across companies.
- ECQDI: Earnings call quantitative dynamics and intensity, measured from external analyst contributions relative to earlier calls in the same sector.
External analysts bring company knowledge, financial models and sector experience to the discussion. Their participation can reflect where they allocate research effort; their questions can reflect the expectations and concerns formed through that work. ECPND studies the participation record. ECQDI studies a quantitative property of the recorded contributions. The same people can raise different issues across calls, while different groups can produce similar discussion patterns.
This gives the combination a plausible rationale: one input describes the structure of observed attention, while the other describes an aspect of its expression. The rationale is a hypothesis about why the measurements might be useful. It does not establish that either score measures expertise, information quality or a causal driver of returns.
The individual ECPND and ECQDI notes explain the separate factors. This study asks whether their differences matter in a shared portfolio process. It distinguishes three questions: do the scores rank stocks differently, do they change the selected holdings, and do those changes improve subsequent returns?
02A common test environment
Both factors are evaluated on the same stock candidates, forecasts, prices and trading dates. This makes the selection rule the deliberate difference between portfolios.
The study reuses the frozen inputs from the individual-factor tests. The model-eligible US equity universe uses S&P 500 membership snapshots as a reference and contains 544 distinct forecast tickers over the period. Membership and eligibility vary by date. This is the research panel used by the model; verification of historical membership, delisted stocks and price coverage remains part of the data-review programme.
| Input | Coverage | Interpretation |
|---|---|---|
| Frozen model forecasts | 2,259,772 rows · 544 tickers | Saved stock-ranking predictions reused by every arm, with repeated observations across decision dates and the four fixed model seeds. |
| Adjusted prices | 782,434 rows · 560 tickers | Frozen USD opening prices for execution and closing prices for daily valuation, with corporate actions represented by the adjusted series. |
| ECPND availability | 96.45% | A valid daily participation value is available on this share of forecast rows, under the score eligibility and 126-session freshness rules. |
| ECQDI availability | 90.41% | A valid call-level text score is available on this share of forecast rows, carried from the latest eligible scored call within 90 calendar days. |
| Both scores available | 90.35% | The intersection of the two coverage sets. The shared-score control requires both values for every candidate, including baseline candidates. |
| Weekly formations | 245 dates | New matched accounts start from 10 January 2022 to 14 September 2026. Prices end on 18 September; only completed horizons enter their means. |
The coverage percentages count forecast rows, including repeated dates and model seeds. They describe the availability of the two scores within this panel, rather than the proportion of all US-listed stocks covered. The main comparison allows eligible stocks without a score. A separate control restricts every arm, including the baseline, to stocks with both scores.
2.1 Baseline model and training chronology
Microsoft Qlib provides the research framework [1]. The model uses 157 available price and volume features from its Alpha158 family [2], with LightGBM generating stock-ranking predictions [3]. The training target is the adjusted return from the next session's open to the 42nd session's close, standardized across stocks on each training date.
Models are fitted annually on expanding windows, using only training returns that ended before the test year. Each fit uses 200 boosting rounds and four fixed random seeds - 19, 41, 73 and 101. The seeds vary randomized model choices while sharing the same market history. Both factors are applied to the saved predictions; neither is added to the model's training features in this study.
Role of the published software. Qlib and LightGBM provide the modelling foundation. The US data preparation and weekly portfolio simulator are our implementations. The experiment is not an unchanged official Qlib benchmark, and the software authors have not validated these factor results.
2.2 Score timing and persistence
- ECPND: Use the archived daily value for the decision date. Eligible participation history can evolve without a new issuer call; the latest eligible call expires at age 126 US sessions.
- ECQDI: Use the latest eligible scored call from an earlier date, up to age 90 calendar days. Its call-level value is carried forward until replaced or expired.
- Portfolio decision: Join the scores eligible at execution with the preceding close's model predictions. A call cannot affect a trade on its own date in this experiment.
For example, a Friday call can be used at Monday's decision if Monday is a US trading session. A Tuesday call becomes eligible at Wednesday's opening, while the weekly strategy normally waits until its next scheduled decision. ECQDI's sector reference uses strictly earlier call dates. ECPND's historical outcome evidence is eligible only after its measurement period has ended.
A newer call without an eligible ECQDI value does not automatically remove an older, still-valid scored call. ECPND follows its own daily eligibility rules. The two fields therefore need not have the same coverage or change on the same dates. Missing values remain missing rather than being replaced with zero.
Historical timing. The next-session convention leaves a buffer after same-day transcript delivery. The study uses stored transcript versions and saved scores. Source-call checks verify ordering; historical revisions and the exact first-release version require separate verification. Recording the publication time of both live score inputs is necessary for a prospective combined test.
03Different rankings, different decisions
The measured scores are weakly related in the cross-section. That observation is more precise than calling them “uncorrelated” or “independent”.
3.1 How similarly do the factors rank stocks?
At each formation and seed, we calculate Spearman correlation across the stocks with both scores. We average the seed coefficients within each date and then give the 245 weekly dates equal weight. The resulting mean is +0.076, with a median of +0.070. Weekly values range from -0.055 to +0.180; their fifth and ninety-fifth percentiles are approximately −0.006 and +0.155.
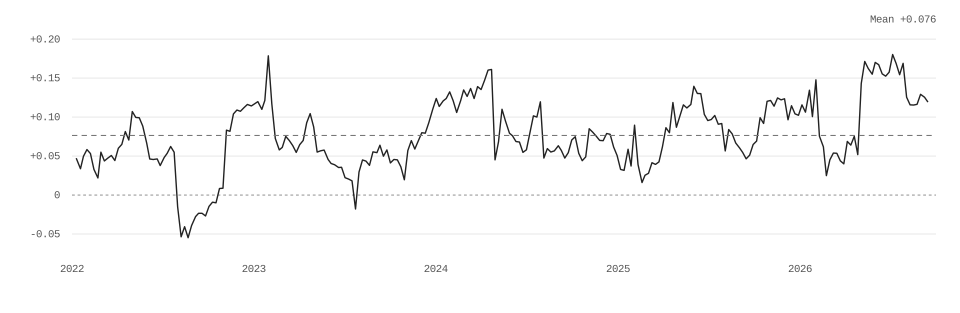
A low coefficient means the scores are not close substitutes as stock rankings in this sample. It does not exclude nonlinear dependence, common sector influences or shared sensitivity to source quality. The average is also not zero, and it should not be converted into a claim that the factors contain entirely independent information.
3.2 Which stocks receive lower priority?
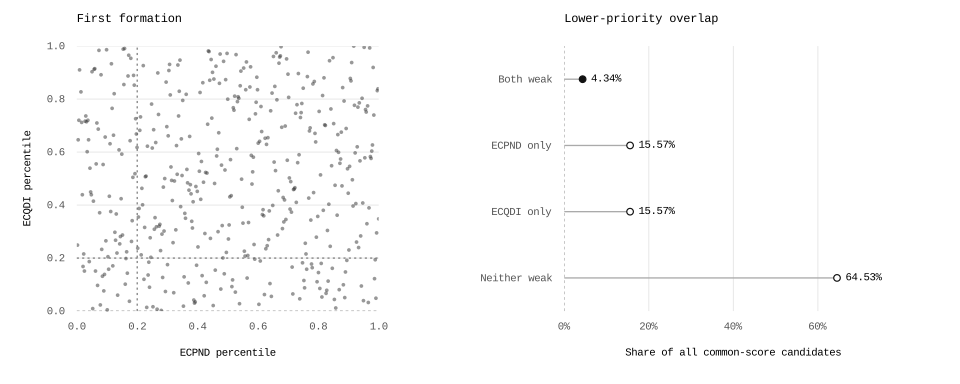
The left panel shows the first chronological formation, not an example selected for attractive returns. Its 433 stocks have both scores; dotted lines mark the lower-fifth boundaries. The right panel summarizes all formations after recomputing ranks in the shared-score universe.
Within the shared-score universe, the lower-fifth groups overlap on 4.34% of all candidates. ECPND alone flags 15.57%, ECQDI alone flags 15.57%, and neither flags 64.53%. The mean intersection divided by the union of flagged groups is 12.28%. Thus the two rules often lower the priority of different stocks, even though both are derived from earnings calls.
The denominator matters: 4.34% is a share of all common-score candidates, not a share of the already flagged stocks. Percentages are means of formation-level fractions with the four seeds equally weighted. Ties mean a lower-fifth rule need not flag exactly 20% of stocks.
3.3 Different scores can still produce similar account returns
| Measurement | Coefficient | What is compared |
|---|---|---|
| Scores | +0.076 | Cross-sectional Spearman; weekly mean |
| Accounts | +0.989 | Pearson of daily account returns; seed mean |
| Active | +0.383 | Pearson after subtracting Qlib; seed mean |
The individual-factor portfolios’ daily returns correlate at approximately +0.989. They share a long-only market exposure, a Qlib ranking and many holdings. Their active daily returns - each factor account’s return minus its matching baseline account’s return - correlate at approximately +0.383.
A rank correlation concerns stock ordering; a return correlation concerns account movements. These return coefficients are calculated separately for each seed over the same 1,177 sessions, then averaged. The first session’s return includes entry relative to the original $1 million. Both active series subtract the same baseline; they are not residuals from a comprehensive risk-factor model. Weak score correlation therefore provides evidence of different inputs, while the portfolios remain strongly exposed to common market movements.
04The paired portfolio design
The model ranks the candidates. Each factor rule changes their selection priority while leaving capital, execution and accounting the same.
4.1 The original comparison
- Qlib baseline: Select the 50 highest model predictions, breaking ties alphabetically by ticker.
- With ECPND: Lower the priority of the weakest 20% of available ECPND scores, then select 50 stocks.
- With ECQDI: Apply the same priority rule using ECQDI alone, then select 50 stocks.
- Both, 50/50 ranks: Combine the two current percentile ranks and lower the priority of the weakest 20% of that composite.
The model still decides which stocks fill the portfolio within each priority group. A low-priority stock is not permanently excluded, and a high factor score does not guarantee a place. The comparison tests the contribution of a supplied score to this selection process, rather than a portfolio ranked solely by either factor.
4.2 How to apply the 50/50 combination
- Join the inputs. Use each stock's scores eligible for the execution date and the common prior-close model prediction. Do not add another delay to an already eligible daily score or use a later observation.
- Rank each score. Sort nonmissing values from lowest to highest across the complete eligible universe. Divide average ordinal rank by the number of scored stocks. Ties share their average rank, and each component requires at least 30 observations.
- Combine the ranks. Give the two component percentiles equal weight. An unavailable or unsupported component contributes a neutral 0.5; if neither is supported for a stock, its composite is missing.
- Rank the composite. Round it to 12 decimal places to preserve numerical ties, then apply the same average-rank method. With at least 30 valid composites, values at or below the 20th percentile receive lower priority.
- Select the holdings. Put unpenalized candidates first and penalized candidates second. Within each group, sort predictions from highest to lowest, then tickers alphabetically. Take the first 50; with fewer than 50 eligible stocks, form no portfolio.
Example. A stock at the 10th ECPND percentile and the 80th ECQDI percentile has a composite value of 0.45. Its selection flag then depends on where 0.45 ranks among all valid composites that day. It is not tested against a fixed raw-score threshold of 0.20. The weights combine score ranks, not portfolio capital or the Qlib prediction.
Missing composites do not enter the percentile calculation and receive no penalty. A numerical zero remains a valid score. When fewer than 30 composite observations exist, the composite rule leaves the model ranking unchanged. If fewer than 50 unpenalized candidates exist, lower-priority candidates fill the remaining places in model order.
4.3 A separate rule: either score is weak
The simultaneous-filter check gives a stock lower priority when either score is in its own bottom fifth. Both ranks are calculated in the original candidate universe before any selection. The second score is not reranked after applying the first. A missing component creates no weak-score flag.
The distinction matters: a strong component can offset a weak one in the 50/50 average, while the either-score rule still flags the stock. The latter usually changes more candidates' priority. It is reported as a separate application, followed by a control for its greater selection strength in Section 9.
4.4 Execution and evaluation
- Formation: Start a new matched group at the first eligible US session of each week, normally Monday. Every account begins with $1 million and uses the same decision date.
- Allocation: Select 50 long positions with equal target weights across 95% of pre-trade equity. Fractional adjusted share units are allowed; fees reduce cash, which earns no interest.
- Buy & hold: Apply selection at entry and retain the initial share quantities through the holding period. Subsequent score changes or expiry do not trigger scheduled trades.
- Weekly rebalance: Repeat selection and reset equal target weights at each week's first eligible session. This includes resizing stocks that remain in the account.
- Prices and costs: Trade at adjusted opens and value at adjusted closes plus cash. Charge 10 bp on each executed buy or sell; corporate actions are represented in the adjusted prices.
- Horizons: Measure 3, 6 and 12 calendar months at the last session close on or before the anniversary. Do not force a terminal sale or add a separate dividend cash flow.
4.5 What the reported difference means
For a given date, seed, policy and horizon, subtract the reference account's return from the candidate account's return. Average the four seed differences within each formation, then give each completed formation equal weight. The three horizons contain 232, 219 and 193 completed dates. Differences in basis points describe that holding period; they are not annualized or adjusted for other equity exposures.
Weekly formations share much of their holding period. To estimate uncertainty without treating all weeks as independent, the calculation repeatedly samples consecutive blocks of weekly differences, wrapping from the end of the series to its beginning where needed [4].
- Resamples: Recalculate the mean for 5,000 block-resampled versions of the formation history.
- Block lengths: Use 13, 26 and 52 weeks for the 3-, 6- and 12-month comparisons.
- Reported interval: Use the 2.5th and 97.5th percentiles of the resampled means.
The intervals describe uncertainty under this resampling design. They do not correct for every earlier research choice or for selecting among many configurations on the same history. The original combination rules were fixed before their portfolio outcomes were calculated, but the period and individual factors had already been studied.
05The primary combination against both references
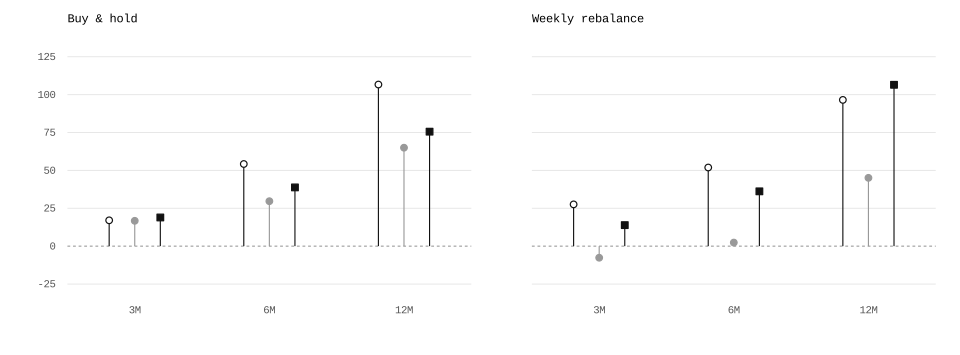
The 50/50 composite improves on Qlib in all six mean horizon comparisons. It does not consistently improve on ECPND alone.
| Horizon | Qlib | ECPND | ECQDI | Both 50/50 | Both − Qlib, bp |
|---|---|---|---|---|---|
| Buy & hold | |||||
| 3M | 3.22% | 3.39% | 3.39% | 3.41% | +18.9 |
| 6M | 6.05% | 6.59% | 6.34% | 6.43% | +38.8 |
| 12M | 14.53% | 15.60% | 15.18% | 15.29% | +75.6 |
| Weekly rebalance | |||||
| 3M | 2.46% | 2.74% | 2.39% | 2.60% | +13.9 |
| 6M | 5.34% | 5.86% | 5.36% | 5.70% | +36.2 |
| 12M | 11.39% | 12.36% | 11.85% | 12.46% | +106.5 |
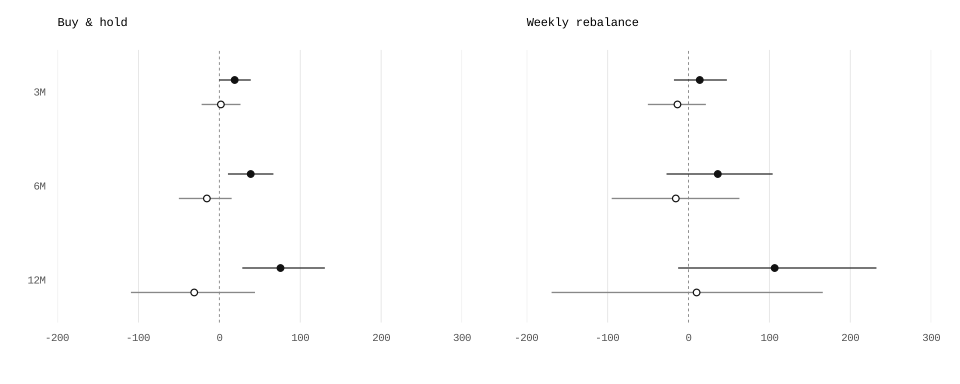
For six-month buy & hold, the composite earns 6.43% versus 6.05% for Qlib: a +38.8 bp difference, with a 95% interval from +10.6 to +66.8 bp. ECPND alone earns 6.59%. Adding ECQDI through this particular equal-rank rule therefore lowers the mean result by 15.5 bp relative to ECPND.
View all differences against ECPND and their intervals
| Horizon | Difference, bp | 95% interval, bp | Positive weeks | Formations |
|---|---|---|---|---|
| Buy & hold | ||||
| 3M | +1.9 | [-21.9, +26.1] | 50.9% | 232 |
| 6M | -15.5 | [-50.1, +15.2] | 47.0% | 219 |
| 12M | -31.1 | [-109.3, +44.0] | 44.0% | 193 |
| Weekly rebalance | ||||
| 3M | -13.7 | [-50.3, +21.4] | 42.7% | 232 |
| 6M | -15.7 | [-95.0, +62.9] | 42.9% | 219 |
| 12M | +10.0 | [-169.3, +166.0] | 59.6% | 193 |
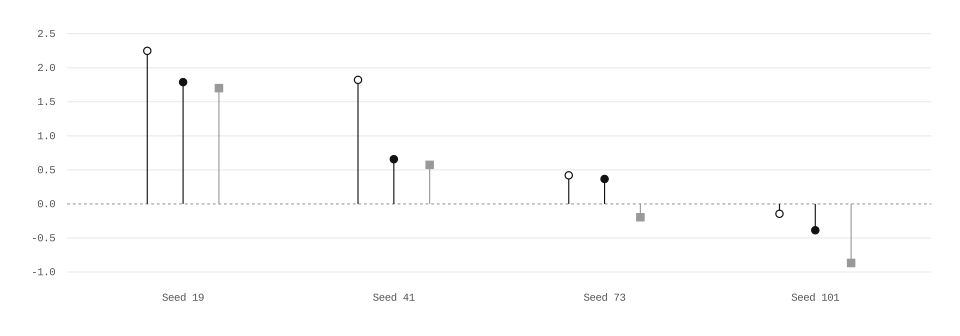
The two panels separate buy & hold from weekly rebalancing. Filled markers compare the combination with Qlib; open markers compare that same combination with ECPND alone. All six intervals against ECPND include zero.
The composite slightly exceeds ECPND at three-month buy & hold and twelve-month weekly rebalancing, while trailing it in the other four mean comparisons. The positive cases remain part of the record, but their intervals also include zero. This mixed pattern is consistent with different information whose usefulness depends on how the portfolio rule uses it.
06A stronger selection check
The original simultaneous filters improve the buy & hold mean relative to ECPND20. A stricter single-factor control changes the interpretation of that comparison.
The simultaneous-filter rule raises six-month buy & hold return to 6.78%, or +73.9 bp versus Qlib and +19.7 bp versus ECPND alone at its original 20% threshold. At twelve months the corresponding differences are +158.1 and +51.4 bp. These are measured gains over those specific references; they do not yet isolate the information supplied by ECQDI.
View all horizons for the either-score rule
| Horizon | Return | Δ Qlib, bp | Δ ECPND, bp | 95% interval vs ECPND |
|---|---|---|---|---|
| Buy & hold | ||||
| 3M | 3.48% | +25.4 | +8.3 | [-12.5, +33.8] |
| 6M | 6.78% | +73.9 | +19.7 | [-11.6, +57.9] |
| 12M | 16.12% | +158.1 | +51.4 | [-15.2, +133.4] |
| Weekly rebalance | ||||
| 3M | 2.58% | +11.2 | -16.4 | [-52.7, +14.9] |
| 6M | 5.68% | +33.8 | -18.1 | [-76.5, +36.3] |
| 12M | 12.21% | +81.7 | -14.9 | [-146.3, +88.6] |
The incremental six-month interval versus ECPND is −11.6 to +57.9 bp; at twelve months it is −15.2 to +133.4 bp. Both include zero. The weekly-rebalanced comparisons against ECPND are negative at all three horizons. These limits prevent the buy & hold means from establishing a reliable improvement across implementations.
Different information, but also a stronger rule
The simultaneous filters lower the priority of approximately 33.46% of all candidates in the full universe, compared with 19.22% under the primary composite. They change an average of 16.42 holdings relative to the baseline; the composite changes 9.24. The two tests therefore differ in both the information used and the breadth of the selection intervention.
The original five-arm experiment did not include an ECPND-only filter calibrated to flag exactly the same number of stocks on every date. The completed extension in Section 9 now provides that control. It changes the interpretation of the original positive mean: the 20% / 20% simultaneous rule trails an equally broad ECPND-only screen. Its gain over the original ECPND20 reference cannot by itself establish an additional text-factor contribution.
07Continuous portfolios and time variation
The same capital is also carried through the full period. This keeps the combination claim tied to an actual funded account path.
Each continuous account starts on 10 January 2022 and rebalances weekly through 18 September 2026. The mean of the four seed CAGRs is 7.24% for Qlib, 8.33% with ECPND, 6.90% with ECQDI and 7.85% with the equal-rank composite. The simultaneous-filter mean is 7.55%.
| Selection rule | CAGR | Total return | Max drawdown | Sharpe |
|---|---|---|---|---|
| Qlib baseline | 7.24% | 38.85% | -27.60% | 0.44 |
| With ECPND | 8.33% | 45.55% | -25.48% | 0.49 |
| With ECQDI | 6.90% | 36.81% | -26.85% | 0.42 |
| Both · 50/50 ranks | 7.85% | 42.56% | -27.16% | 0.47 |
| Both · simultaneous filters | 7.55% | 40.69% | -26.08% | 0.46 |
Each figure is the arithmetic mean of four separately simulated account metrics. CAGR uses elapsed calendar days divided by 365.2425. Sharpe uses daily returns, sample standard deviation and 252 sessions per year, with no risk-free rate subtracted. Maximum drawdown is measured from each account’s daily value path.
View the four continuous account pairs
| Seed | Qlib CAGR | ECPND CAGR | ECQDI CAGR | Both CAGR | Both − ECPND, pp |
|---|---|---|---|---|---|
| 19 | 6.40% | 8.65% | 5.78% | 8.19% | -0.46 |
| 41 | 6.77% | 8.59% | 6.76% | 7.43% | -1.16 |
| 73 | 8.52% | 8.94% | 8.63% | 8.88% | -0.05 |
| 101 | 7.28% | 7.14% | 6.41% | 6.90% | -0.24 |
The primary composite improves on Qlib in three seeds, but its mean CAGR is 0.48 percentage points per year below ECPND. Its mean maximum drawdown is also worse: −27.16% versus −25.48%. Low score correlation therefore does not deliver an observed continuous-account risk or growth advantage under this rule.
What the seeds change. Seeds 19, 41, 73 and 101 identify four randomized fits of the same baseline model. They can produce different stock rankings and therefore different holdings. Within each seed, all arms reuse the identical forecasts. The comparisons reveal sensitivity to the baseline fit; the seeds do not represent four independent market histories.
Where the combination helped during the period
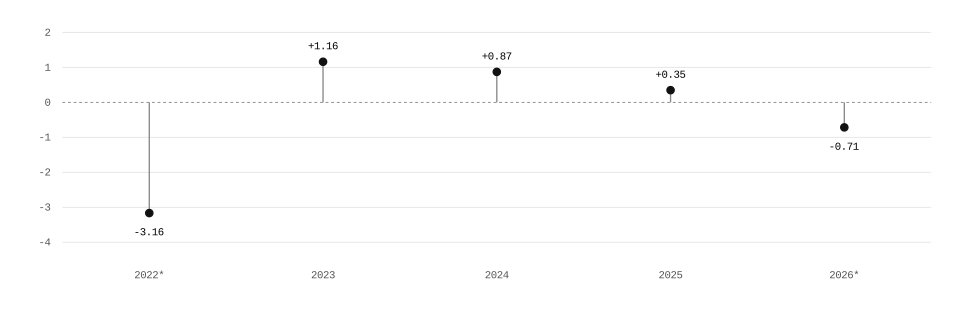
These are calendar-period differences between continuous accounts, not returns grouped by portfolio formation year. Asterisks mark partial years: 2022 starts on 10 January and 2026 ends on 18 September.
This variation gives the complementarity hypothesis a specific form: ECQDI may be useful in some environments or portfolio applications even when a permanent equal-weight mix is weaker over the full history. The chart does not identify a tradable regime rule. Selecting only the favourable years after observing them would turn a descriptive result into hindsight.
- Score correlation: How similarly the factors rank the stocks available on the same date.
- Return correlation: How similarly account returns move, including their shared market exposure.
- Incremental contribution: The combination's return minus the return of its stated reference.
- CAGR: The constant annual growth rate equivalent to a continuous account's total return.
08Coverage and trading-cost controls
A useful combination must be distinguished from changes in which stocks can be scored and how much it costs to trade them.
The same both-scored universe
We repeat all five arms using only stocks with both scores. Every arm, including Qlib, uses this smaller candidate set; component ranks are recomputed within it. The comparison therefore controls for the different score coverage rather than counting a universe change as a factor improvement.
View results when every candidate has both scores
| Selection rule | 6M B&H return | 6M weekly return | Mean weekly CAGR |
|---|---|---|---|
| Qlib baseline | 6.26% | 5.77% | 8.71% |
| With ECPND | 6.78% | 6.11% | 9.39% |
| With ECQDI | 6.59% | 5.67% | 8.36% |
| Both · 50/50 ranks | 6.67% | 6.13% | 9.32% |
| Both · simultaneous filters | 6.99% | 5.73% | 8.38% |
In this common-score universe, mean continuous CAGR is 9.32% for the composite and 9.39% for ECPND. The gap is much smaller than in the unrestricted run, and two of four composite accounts improve on ECPND. The mean remains slightly lower. The restricted baseline itself earns 8.71%, so these absolute results cannot be compared with the unrestricted 7.24% baseline as if only a score weight had changed.
Fee sensitivity
View continuous-account trading-cost sensitivity
| Cost per side | Qlib CAGR | ECPND CAGR | Both CAGR | Both − ECPND, pp |
|---|---|---|---|---|
| 0 bp | 13.89% | 14.83% | 14.33% | -0.50 |
| 10 bp | 7.24% | 8.33% | 7.85% | -0.48 |
| 25 bp | -2.03% | -0.76% | -1.22% | -0.46 |
The composite trails ECPND at zero, ten and twenty-five basis points per executed side. Its shortfall is approximately 0.50, 0.48 and 0.46 percentage points of mean annualized growth respectively. Removing the modelled fee does not reverse the comparison. At 25 bp, all displayed continuous growth rates are negative.
These are flat-cost sensitivities, not estimates of spread, stock-specific liquidity, market impact or capacity. The experiment cannot establish that a particular investor can capture the historical differences after its own execution costs.
09Weighting, thresholds and stronger controls
The completed extension tests how the factors are used, and whether a second score adds more than a stricter single-factor screen.
The additional experiment fixes seven ECPND weights - 0%, 25%, 40%, 50%, 60%, 75% and 100% - with ECQDI receiving the balance. Each rank composite is tested at a lower-priority fraction of 10%, 20%, 30% or 50%. A second family tests every pair of those thresholds, flagging either one weak score (OR) or two weak scores together (AND). These are score-rank weights and selection conditions, not allocations of capital between portfolios.
- Ranks 75/25: Combine 75% of the ECPND percentile with 25% of the ECQDI percentile, then apply the stated composite threshold.
- OR 50% / 20%: Lower priority when ECPND is in its bottom half or ECQDI is in its bottom fifth. These are two thresholds, not weights.
- AND 50% / 20%: Lower priority only when both conditions are met. A stock weak on just one factor is not flagged.
- ECPND20 or ECPND50: Use ECPND alone, lowering priority for its weakest 20% or 50% of available scores.
There are 60 selection rules, 52 count-matched ECPND controls and the baseline: 113 arms in each universe. The study completes 419,456 funded cohort simulations and 1,808 continuous accounts, using the unchanged four seeds, prices, costs and timing conventions. The full and both-scored universes each retain their own matching baseline. Rules were fixed before this extension ran; the underlying history had already been researched; verification records are described in Appendix A.
The 60 rules comprise 28 weight/threshold settings, 16 OR pairs and 16 AND pairs. At an interior weight, missing components receive the neutral percentile described in Section 4. At the 0% and 100% endpoints, the selected component’s original percentile is used directly; the unused component cannot make a missing score eligible. OR and AND flags use the two ranks calculated before filtering. A missing component creates no weak-score flag. A flag changes priority, not eligibility: flagged names can still fill vacancies.
Changing the relative weights
View all seven weights at the 20% threshold
| ECPND / ECQDI | 6M B&H Δ Qlib, bp | 6M B&H Δ ECPND20, bp | 6M weekly Δ ECPND20, bp | Weekly CAGR |
|---|---|---|---|---|
| 0 / 100 | +29.7 | -24.5 | -49.5 | 6.90% |
| 25 / 75 | +35.8 | -18.4 | -36.2 | 7.32% |
| 40 / 60 | +37.9 | -16.3 | -34.4 | 7.48% |
| 50 / 50 | +38.8 | -15.5 | -15.7 | 7.85% |
| 60 / 40 | +40.1 | -14.1 | -11.7 | 7.97% |
| 75 / 25 | +69.2 | +15.0 | -11.9 | 7.81% |
| 100 / 0 | +54.2 | +0.0 | +0.0 | 8.33% |
At the original 20% selection threshold, the 75/25 blend produces +69.2 bp over Qlib in six-month buy & hold, or +15.0 bp over ECPND20. The equal-weight blend produces +38.8 bp over Qlib. More weight on the participation factor helps this particular comparison, but the 75/25 blend’s continuous CAGR remains below ECPND20: 7.81% versus 8.33%.
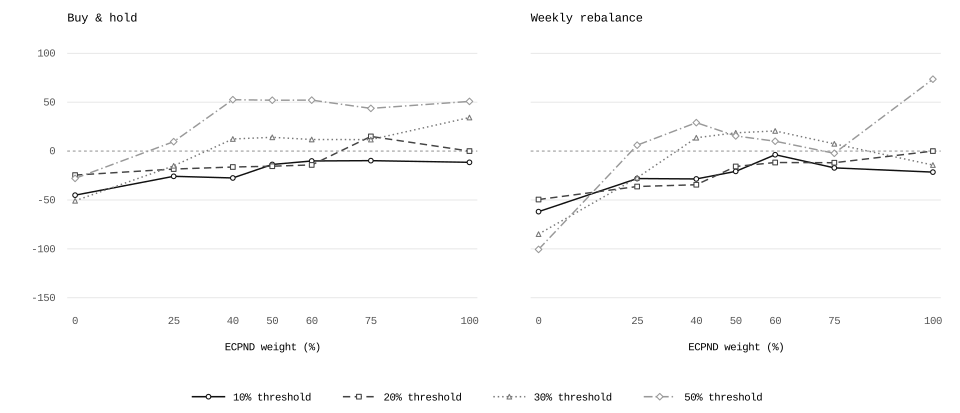
In the weight chart, the horizontal axis is the share of ECPND in the score blend; ECQDI receives the balance. Each line fixes a selection threshold. The 0% and 100% endpoints are single-factor rules. Both panels use the same return unit and scale, so differences between the management policies remain visible. These curves show means, not uncertainty bands.
Match the strength of the screen
A combination may look better simply because it changes more candidates' priority. The matched control asks a narrower question: if ECPND alone acts on the same number of stocks, does the combination still help?
- Count the flags. On each date and seed, count how many candidates the combination gives lower priority.
- Match that number. Flag exactly that many of the lowest available ECPND scores, breaking a boundary tie by ticker.
- Keep selection identical. Apply the same model ordering, 50-stock allocation, execution rules and costs to both accounts.
Unlike the ordinary percentile rule, the exact-count control may split a tied score group at the boundary. The calculation stops if too few ECPND scores are available; this did not occur. All 101,920 checked candidate counts match. The control equalizes the number of flags, rather than sector exposures or the number of holdings ultimately replaced.
| Combination | Δ Qlib, bp | Δ ECPND20, bp | Δ matched, bp | 95% interval, bp |
|---|---|---|---|---|
| Ranks 50/50 | +38.8 | -15.5 | -15.2 | [-50.0, +15.4] |
| Ranks 75/25 | +69.2 | +15.0 | +15.2 | [-3.8, +31.8] |
| OR 20% / 20% | +73.9 | +19.7 | -11.2 | [-38.9, +17.5] |
| OR 50% / 20% | +131.3 | +77.1 | +14.1 | [-19.0, +52.8] |
| AND 50% / 50% | +46.5 | -7.7 | -18.1 | [-70.5, +26.5] |
The original OR 20% / 20% rule’s +73.9 bp versus Qlib is lower than the matched ECPND-only control’s +85.1 bp. The incremental text comparison is therefore −11.2 bp, with an interval of −38.9 to +17.5 bp. The positive original result can be explained without establishing a benefit from the second score.
The largest six-month buy & hold combination mean in this grid comes from OR 50% / 20%: +131.3 bp versus Qlib. Its difference shrinks to +14.1 bp against the equally broad ECPND control, with an interval of −19.0 to +52.8 bp. This is a historical grid maximum, not a validated optimum. The 75/25 blend also retains a positive matched-control mean, +15.2 bp, but its interval includes zero.
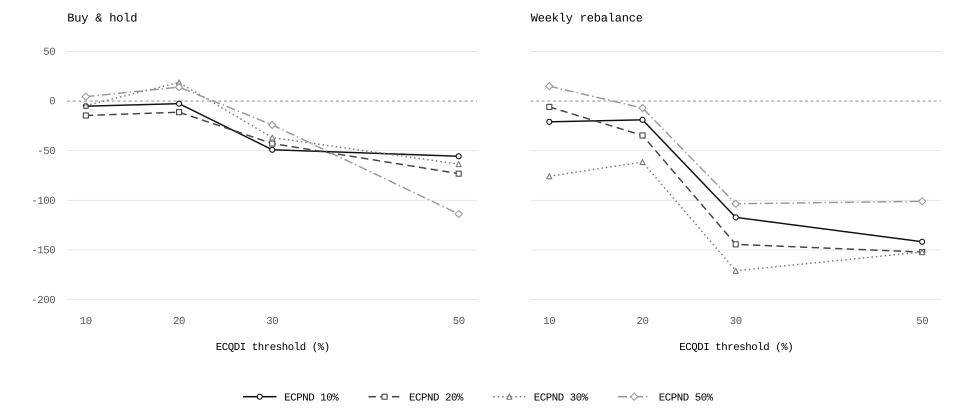
For the OR curves, the horizontal axis sets the ECQDI threshold and each line fixes the ECPND threshold. Every point has its own control with the same number of flagged candidates. The comparison is therefore with equally broad ECPND selection, rather than the fixed ECPND20 rule. The complete intervals remain in the study records.
Requiring agreement between the factors
AND rules act only where both scores are weak, so they flag a smaller part of the universe. AND 20% / 20% flags approximately 3.9% of candidates. Even AND 50% / 50% flags only 23.5%; it adds +46.5 bp versus Qlib in six-month buy & hold, but trails its count-matched ECPND control by 18.1 bp. Its weekly-rebalanced mean is +41.4 bp above that control. Requiring agreement changes the intervention and can change the preferred management policy; it is not uniformly better than taking the union.
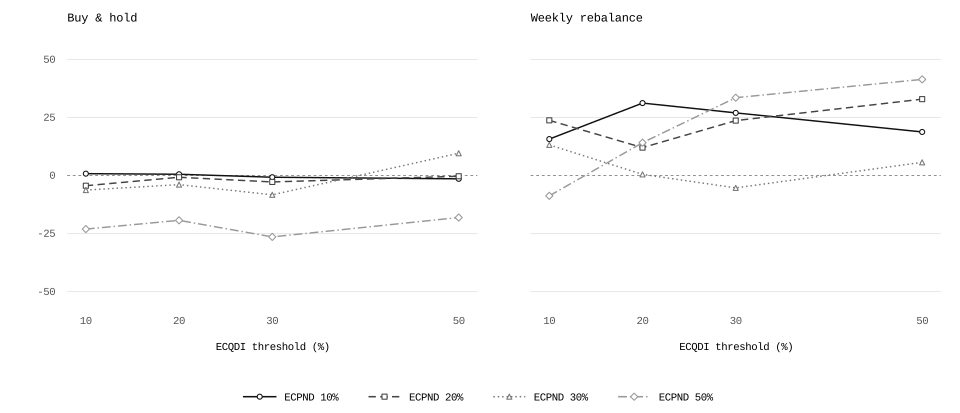
The AND chart uses the same axis conventions but flags a stock only when both components are weak. Its narrower intervention changes which candidates are affected and how the control is constructed. The two panels again separate entry-only selection from repeated weekly use.
Other horizons and shared score coverage
View all horizons against the matched ECPND controls
| Horizon | Ranks 75/25 | OR 20% / 20% | OR 50% / 20% | Formations |
|---|---|---|---|---|
| Buy & hold | ||||
| 3M | +14.1 [+4.3, +23.8] | -8.3 [-33.7, +19.5] | +8.4 [-14.3, +31.4] | 232 |
| 6M | +15.2 [-3.8, +31.8] | -11.2 [-38.9, +17.5] | +14.1 [-19.0, +52.8] | 219 |
| 12M | +11.5 [-43.0, +50.7] | +10.3 [-45.5, +73.1] | +47.5 [-15.2, +106.6] | 193 |
| Weekly rebalance | ||||
| 3M | -10.5 [-41.8, +16.3] | -15.9 [-54.7, +23.1] | -4.4 [-44.9, +37.4] | 232 |
| 6M | -10.5 [-82.4, +49.2] | -34.6 [-96.6, +18.4] | -7.0 [-86.7, +70.1] | 219 |
| 12M | +15.9 [-79.1, +103.9] | -70.3 [-166.4, +36.2] | +5.8 [-121.9, +116.1] | 193 |
The table keeps all three horizons and both management policies for the original OR rule, the 75/25 blend and the strongest full-period OR rule. Each is compared with its own exact-count control. Different reference portfolios matter: a positive difference versus ECPND20 can coexist with a negative difference versus count-matched ECPND.
Requiring both scores in every arm does not resolve that distinction. At six-month buy & hold, the 75/25 blend adds +17.9 bp and OR 50% / 20% adds +8.8 bp versus their matched controls; both intervals include zero. OR 20% / 20% remains negative at −11.6 bp. The corresponding weekly-rebalanced differences are −7.7, +4.7 and −43.3 bp. All rules are reranked in this smaller universe, with its own baseline. The full set of coverage comparisons is retained in the download.
Choose earlier, evaluate later
Two historical selection exercises use only 77 six-month formations whose outcomes matured before 1 January 2024. One selects among the seven weights at the 20% threshold; the other selects among all 60 grid rules. The criterion is the earlier mean difference over ECPND20. The chosen rule is then fixed for later formations. Holdings crossing the split are excluded from these comparisons.
| Earlier-period choice | Early Δ ECPND20, bp | Later Δ ECPND20, bp | Later 95% interval, bp |
|---|---|---|---|
| Ranks 75/25 | +26.6 | +2.2 | [-23.6, +28.5] |
| OR 10% / 50% | +74.6 | -66.0 | [-165.9, +14.4] |
The earlier data choose 75/25 within the weight-only set. Its six-month advantage falls from +26.6 bp early to +2.2 bp across 116 later formations. Searching the entire grid selects OR 10% / 50%; its early +74.6 bp becomes −66.0 bp later. Selection maximizes the earlier six-month buy & hold mean difference over ECPND20, with rule identifiers breaking ties. Count-matched controls are not candidates in the 60-rule selection.
View all later horizons for the two earlier-period choices
| Horizon | Ranks 75/25 | OR 10% / 50% | Formations |
|---|---|---|---|
| Buy & hold | |||
| 3M | +8.4 [-2.3, +18.5] | -71.1 [-169.1, +11.7] | 129 |
| 6M | +2.2 [-23.6, +28.5] | -66.0 [-165.9, +14.4] | 116 |
| 12M | -7.4 [-66.2, +50.7] | +154.9 [+63.4, +246.7] | 90 |
| Weekly rebalance | |||
| 3M | -18.0 [-69.8, +25.8] | -39.4 [-168.6, +72.7] | 129 |
| 6M | -22.4 [-138.1, +77.9] | -40.5 [-168.3, +72.3] | 116 |
| 12M | +15.6 [-126.9, +159.6] | -26.1 [-180.1, +124.5] | 90 |
The later twelve-month buy & hold result for the selected OR 10% / 50% rule is positive: +154.9 bp, with a pointwise interval of +63.4 to +246.7 bp. It remains part of the record alongside weaker three- and six-month results and negative weekly-rebalanced means. Different horizons cover different completed cohorts. These mixed outcomes do not validate a horizon selected after seeing the results. The split respects outcome maturity, but remains a re-examination of previously inspected history rather than a new prospective holdout.
Continuous accounts keep the result in perspective
| Selection rule | Full CAGR | Both-scored CAGR | Full max drawdown |
|---|---|---|---|
| Qlib baseline | 7.24% | 8.71% | -27.60% |
| ECPND · weakest 20% | 8.33% | 9.39% | -25.48% |
| ECPND · weakest 50% | 9.34% | 11.45% | -27.46% |
| Ranks 75/25 · weakest 20% | 7.81% | 8.97% | -26.02% |
| OR 50% / 20% | 9.33% | 11.17% | -26.80% |
| ECPND · matched to 50% / 20% | 9.61% | 11.05% | -27.69% |
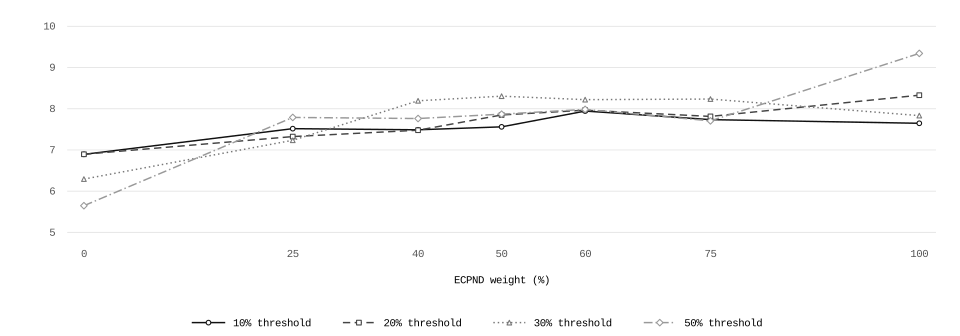
OR 50% / 20% has the highest continuous CAGR among the tested two-factor rules, 9.33%. ECPND alone at a 50% threshold earns 9.34%, while the combination’s count-matched ECPND control earns 9.61%. The continuous evidence therefore does not justify presenting the strongest combined mean as something a single-factor application could not achieve.
View the extended trading-cost comparison
| Cost per side | Qlib | ECPND20 | ECPND50 | OR 50% / 20% | Matched ECPND |
|---|---|---|---|---|---|
| 0 bp | 13.89% | 14.83% | 15.25% | 14.98% | 15.21% |
| 10 bp | 7.24% | 8.33% | 9.34% | 9.33% | 9.61% |
| 25 bp | -2.03% | -0.76% | 1.03% | 1.34% | 1.68% |
The same comparison is recomputed at each fee level. OR 50% / 20% falls from 14.98% CAGR at zero costs to 9.33% at 10 bp and 1.34% at 25 bp. Its matched ECPND control remains ahead at all three levels. This measures sensitivity to flat trading fees; it does not estimate actual spreads, market impact or capacity.
View the extended comparison by model seed
| Seed | ECPND20 | ECPND50 | Ranks 75/25 | OR 50% / 20% | Matched ECPND |
|---|---|---|---|---|---|
| 19 | 8.65% | 9.09% | 8.67% | 9.12% | 8.61% |
| 41 | 8.59% | 9.88% | 7.64% | 9.85% | 10.03% |
| 73 | 8.94% | 9.41% | 8.52% | 8.86% | 10.28% |
| 101 | 7.14% | 8.99% | 6.43% | 9.48% | 9.51% |
The strongest full-period OR rule improves on ECPND20 in three of four seed accounts, while the 75/25 blend does so in only one. Against the stronger matched control, OR 50% / 20% also improves in only one of four seeds. These are different randomized model fits on the same market history, not four independent investment experiments. Formation-year and per-seed breakdowns, together with continuous calendar-year returns, are supplied for every rule.
Interpretation of the extension. Different inputs remain plausible complements, but a substantial part of the apparent improvement comes from how strongly selection is filtered. Some buy & hold applications retain a positive conditional mean. Their incremental uncertainty, weaker later results and continuous-account comparisons prevent a claim of dependable combined outperformance. Intervals are pointwise and do not correct for this grid or the earlier research process.
10Interpretation and further research
The factors provide different rankings. The remaining question is how to turn that difference into a contribution that survives stronger controls and new observations.
The descriptive evidence is clear within this panel: mean score correlation is +0.076, the weak-score groups overlap only partially, and the primary combination replaces an average of 6.35 of the 50 ECPND-only entry holdings. The second factor changes actual decisions. That is a reason to study it as a separate input, rather than treating it as another name for the same ranking.
The performance conclusion is more conditional. Some combined buy & hold rules retain positive mean differences over equally broad ECPND controls. Their intervals include zero, and the original either-score rule has a negative matched difference. Continuous accounts and later formations also weaken the case for a fixed combined rule. Low score correlation creates an opportunity for complementary information; it does not, by itself, establish a more accurate forecast or a more profitable portfolio.
10.1 Refine the application
- Weights and thresholds: Carry a small, declared set of combinations into the next test. Keep score weights separate from selection strength and retain equally broad single-factor controls.
- Holding policy: Compare entry-only use, weekly decisions and slower refresh schedules. Measure the resulting turnover and costs alongside any change in portfolio returns.
- Conditional information: Test ECQDI after controlling for ECPND and the model prediction. Include sector, size, momentum and liquidity to identify what the second input adds.
- Independent portfolios: Apply the supplied scores to separately chosen stock-ranking models and universes. An application should be judged within the investment process that would use it.
The completed count-matched controls address one important confounder: the strength of selection. They do not neutralize common exposures or explain the economic mechanism. Further configuration work should preserve that distinction and avoid promoting whichever setting happens to have the highest historical mean.
10.2 Forward testing of a fixed combination
A prospective combined study requires its own declared protocol. Before new returns are observed, specify the two score versions, availability cut-off, eligible universe, weights, thresholds, missing-score treatment and trading policy. Record each delivered score snapshot and retain later corrections as separate records. This makes the decision reproducible from information actually available at that time.
The forward comparison should retain Qlib, each individual factor, the chosen combination and an equally broad ECPND control. Record holdings, trades, costs and daily values for every arm, then evaluate completed horizons under the same rules. Changes to the factor engine or selection rule should start a separately labelled version. The historical grid presented here is not a live combined track record, and a promising grid setting is not automatically substituted into the existing service.
10.3 Scope of the evidence
- Shared source material: Both factors depend on the call records. Different score rankings do not eliminate common errors in transcript versions, participant identities or observation dates.
- Research reuse: The market history has supported several factor and configuration tests. Reported intervals describe individual comparisons without correcting for that full search.
- Universe and exposures: Historical membership, delistings, sector records and prices need continuing checks. The return differences are not fully exposure-neutral estimates of alpha.
- Implementation: Flat trading fees do not establish spreads, market impact or capacity at a particular capital level. Those depend on the strategy and execution process.
Keeping the two score fields separate is useful for this next stage. A researcher can test whether each adds information inside its own model, choose an appropriate influence for each, and compare the result with the relevant single-factor alternative. The present evidence supports that evaluation without claiming that one permanent mixture is best for every portfolio.
11Research records and independent evaluation
A useful comparison connects the supplied scores to a selection decision, then connects that decision to a fully specified account return.
11.1 An actual formation example
| Ticker | ECPND rank | ECQDI rank | ECPND flag | ECQDI flag | Composite flag | 50/50 selected |
|---|---|---|---|---|---|---|
| NRG | 0.039 | 0.646 | Yes | No | No | Yes |
| DVA | 0.158 | 0.991 | Yes | No | No | Yes |
| MSCI | 0.252 | 0.016 | No | Yes | Yes | No |
| TFX | 0.392 | 0.035 | No | Yes | Yes | No |
| VTR | 0.101 | 0.005 | Yes | Yes | Yes | No |
| MNST | 0.078 | 0.023 | Yes | Yes | Yes | No |
| ALB | 0.876 | 0.675 | No | No | No | Yes |
| DXCM | 0.541 | 0.850 | No | No | No | Yes |
The rows show agreement and disagreement cases from 10 January 2022, seed 19, the first chronological formation. All ranks are calculated in the full candidate set before these examples are chosen. A flag means lower selection priority, not an automatic exclusion. The final column shows whether the stock is selected after applying the composite rule and the common model ranking.
The full example contains both score values, source-call dates, component and composite ranks, priority flags and selection decisions. It makes the distinction between a measurement, a rule and a holding explicit: knowing one component's score alone is insufficient to reconstruct the final portfolio.
11.2 Reproduce the comparison sequence
- Load forecasts: Use the frozen prior-close predictions for each formation and model seed.
- Join the scores: Attach ECPND and ECQDI values eligible under their respective timing rules.
- Rank the inputs: Calculate component percentiles in the complete eligible candidate universe.
- Apply each rule: Construct the stated composite or separate flags before selecting holdings.
- Build the controls: Keep the baseline, individual factors and relevant exact-count ECPND reference.
- Select 50 stocks: Apply priority groups, model order and the disclosed tie and missing-score rules.
- Match execution: Start every arm with identical capital, allocation, trading dates and costs.
- Measure the outcomes: Evaluate both policies and each completed holding horizon separately.
- Compare the returns: Subtract each stated reference and average seeds within formation dates.
- Summarize the evidence: Average completed formations and resample consecutive week blocks.
Run continuous accounts separately, carrying the same capital through time. Their returns must be calculated from their own daily paths; they cannot be reconstructed by compounding the overlapping formation averages.
11.3 Read the records consistently
- Universe:
fullincludes all model-eligible candidates;both_scoredrequires both scores in every arm. - Difference:
deltais the candidate return minus its named reference; multiply by 10,000 for basis points. - Rule identifier:
wdenotes rank weights,orandandseparate conditions, andmatch_the exact-count control. - Time grouping: Formation years describe starting dates; account calendar years describe returns within that year.
The public research pack contains separate ECPND and ECQDI score samples and their individual study records. It provides two years of daily scores ending eight weeks before the package date, rather than the full 2022-2026 history of this combined experiment. The combination's own summaries, cohorts, diagnostics and configuration records are identified in Appendix A.
The published combination records support inspection of the displayed averages, score overlap and application rules. Exact replay of every trade also requires the full score histories, saved model predictions, eligible universe and adjusted prices. The proprietary score measurements and trained baseline model are not supplied in the public download.
-References
- Yang, X., Liu, W., Zhou, D., Bian, J. & Liu, T.-Y. (2020). Qlib: An AI-oriented Quantitative Investment Platform. arXiv:2009.11189. Official Microsoft repository.
- Microsoft Qlib. Alpha158 data handler and feature-processing implementation. Source documentation for the price and volume feature family used by the baseline.
- Ke, G., Meng, Q., Finley, T., Wang, T., Chen, W., Ma, W., Ye, Q. & Liu, T.-Y. (2017). LightGBM: A Highly Efficient Gradient Boosting Decision Tree. Advances in Neural Information Processing Systems 30.
- Politis, D. N. & Romano, J. P. (1991). A Circular Block-Resampling Procedure for Stationary Data. Stanford Department of Statistics, technical report EFS NSF 370. The block lengths and resampling count in this study are implementation choices.
AAppendix: Study evidence and verification
Two frozen experiments support this note: the original five-arm comparison and the wider configuration study. Their records are kept separate, with common inputs and reproduced reference results.
A.1 Original combination experiment - 25 September 2026
The original run compares Qlib, ECPND, ECQDI, the equal-rank composite and the either-score rule. It contains 18,560 cohort simulations, 82,432 paired horizon rows and 80 continuous accounts across the stated coverage and cost checks. No portfolio data gaps are recorded. These are counts of simulations and comparisons over shared history, rather than independent investment experiments.
Fifty-two numerical checks reproduce previous Qlib and individual-factor results, with a maximum absolute difference of 3.11 × 10⁻¹⁵ in return units. Source-call checks examine 549,030 ECPND rows, recording no same-day or future-call violations and no issuer mismatches. These checks establish consistency with the saved inputs and timing rule; they do not independently verify every historical input.
Figures 1-6, Tables 1-9 and the selection example in Table 18 use this experiment. The correlation and overlap diagnostics are descriptive calculations from its saved candidates and account paths. They add no new fitted models or independently observed returns.
A.2 Weighting and selection-strength extension - 25 September 2026
The extension adds 60 declared selection rules and 52 exact-count ECPND controls to the baseline, producing 113 arms in each universe. It retains 419,456 funded cohort simulations, 1,164,352 completed horizon records and 1,808 continuous account paths. Figures 7-10 and Tables 10-17 use these records.
Before interpreting the wider grid, the extension reproduces all 51,520 original cohort horizon records and all 80 original continuous accounts. The largest cohort-return difference is below 2 × 10-15; continuous total-return and CAGR differences are below 3 × 10-15. The different horizon and comparison counts reflect different record types, not missing cases.
Separate aggregation checks reproduce 1,356 arm means. All 101,920 candidate-count checks match, and both chronological selection exercises record zero outcome-maturity violations. These are internal engineering checks. They support the arithmetic and declared comparisons, without establishing source-data accuracy or future performance.
A.3 Chronological selection and uncertainty
The two selection exercises choose a rule using 77 six-month formations whose outcomes end before 1 January 2024. One considers seven weights at the 20% threshold; the other considers all 60 grid rules. The criterion is the early mean difference over ECPND20, with identifiers breaking ties. The selected rule is then fixed for 116 later six-month formations. Cohorts crossing the split are excluded.
This ordering prevents later outcomes from choosing the rule within the exercise. It does not make the later period untouched: both factors and this historical window had already supported research. The reported intervals are per-comparison block-bootstrap intervals, with no adjustment for the full configuration search. The largest grid mean should therefore be read as an exploratory result requiring a new test.
A.4 Study records and replication scope
The original study results and cohort records contain the five full-universe arms at the primary cost for the cohort export. Score diagnostics cover both universes; the selection example retains the complete first formation. Account summaries include the fixed coverage and cost checks, while daily account values contain the full-universe 10 bp paths used for return correlations.
The extension records include summary results, all rule definitions, paired comparisons and earlier/later period results. Continuous accounts, seed comparisons, formation-year results, account calendar years and the verification record retain the broader checks, including unfavourable outcomes.
Returns, drawdowns and interval endpoints are decimal fractions; NAV is in USD. The extension records contain summaries and paired comparisons. The complete compressed grid cohort records and daily paths remain in the internal frozen archive. Summary records alone do not reproduce every trade or permit resampling the original paths. No transcript text, proprietary score recipe or trained model is disclosed.
A.5 Evidence versions
The checksums identify the reviewed evidence used for this edition. Imported research exports retain their original checksums. Charts are presentation assets generated from the same numerical records; changing their typography or layout does not change a score, holding or return. Rebuilding this paper does not rerun the backtests or update either factor's definition.
Evidence checksums
Original reviewed evidence SHA-2563cc17b92f7650ff611613767c34a2939f12d8de62abbb7188e60bab73c6190b6
Follow-up reviewed evidence SHA-2569ea0ba8f3da32b75e1d15d13e6b9857e5061b2bf0f869001db9cced44c56dec9