01Two observations, one portfolio decision
An earnings call reveals who participates and how those participants examine the company. Combining those observations is useful only if it improves the same decision process.
Earnings Call Participation Network and Dynamics (ECPND) evaluates recurring external participation across companies and dates. Earnings Call Quantitative Dynamics and Intensity (ECQDI) measures the quantitative character of external analysts’ contributions relative to earlier calls in the same sector. Both are supplied research scores, not return forecasts or probabilities.
The two perspectives may be complementary. Participation links a company to a wider record of professional attention; quantitative questioning describes an aspect of the conversation itself. Low correlation can make a combination worth testing, but it cannot establish that adding the second input improves a portfolio. The relevant comparison is the combined portfolio against each single-factor portfolio on the same candidates and dates.
The individual-factor studies suggest that recent price volatility may matter for application. This note therefore places the joint overlays inside matched volatility filters. The main presentation uses the most volatile fifth over the preceding 63 trading sessions. The unfiltered universe, alternative volatility windows, thresholds and weighting rules remain visible as controls.
02Data, universe and timing
The new comparison uses the common January 2022-September 2026 panel from the individual-factor studies. It changes portfolio application, not either factor’s calculation.
At each weekly decision, candidate stocks must have eligible forecasts from both Qlib models, sufficient earlier prices for momentum and a valid execution price. All arms use the same dated pool. The volatility filter is applied before the score percentiles are calculated; it is identical for the baseline, single-factor and combined portfolios.
| Input | Coverage | Role |
|---|---|---|
| Participation archive | 78,941 calls | Frozen call records underlying the unchanged ECPND history. |
| Text-factor archive | 78,851 calls · 3,722 tickers | Unchanged ECQDI observations, ranked against strictly earlier sector calls. |
| Common candidates | 541 tickers · 453-497 per week | Both models, prior momentum history and eligible opening prices. |
| Most volatile fifth | 91-100 candidates per week | Both arms use the same prior 63-session volatility pool before score ranking. |
| Weekly starts | 245 · 10 Jan 2022-14 Sept 2026 | 232, 219 and 193 completed formations at 3, 6 and 12 months. |
| Price cut-off | 18 Sept 2026 | Frozen adjusted USD opens and closes; identical accounting across every pair. |
The source archives have different scopes: ECPND’s source snapshot contains 78,941 calls; the recovered ECQDI archive contains 78,851 calls from 3,722 tickers. These counts describe source records, not the number of independently tested investment events. The investable research panel is smaller and uses S&P 500 membership snapshots as a reference. Historical membership, delisting coverage and adjusted-price quality remain relevant to interpretation.
Two factor clocks, one decision time
- ECPND: Use the supplied daily value. Eligible network evidence can evolve between issuer calls; its latest eligible call record expires at 126 US trading sessions.
- ECQDI: Use the latest eligible scored call from an earlier date, through age 90 calendar days. That call’s score is carried forward unchanged.
- Weekly decision: Join both scores eligible at the execution opening to ranking observations from the preceding close.
ECQDI retains the existing strict-prior-date sector reference used in its portfolio research. This differs from the recovered production-order replay when other calls occurred on the same day, while preserving the proprietary text measurement. A newer unscored call does not replace an older, still-valid ECQDI scored observation.
Under the historical convention, a Friday call can inform Monday’s decision if Monday is a US market session. A Tuesday call can become eligible on Wednesday, while a weekly portfolio waits for its next scheduled decision. ECPND’s historical outcome evidence enters only after its measurement period has ended. Live decisions must additionally respect the actual publication time of each retrieved score snapshot.
03Two scores, two perspectives
Both factors are daily scores between 0 and 1 for US stocks, built from the same earnings calls but from different observations. Each is described in its own paper; this section summarizes what they measure.
ECPND: who takes part
ECPND reads the recurring participation of external analysts as a network that links companies through the analysts they share. The score evaluates a company through its position in that network and how the network changes over time. A company's latest call stays eligible for 126 trading sessions, and the score can change between calls as connected companies report. Details are in the ECPND paper.
ECQDI: how they question
ECQDI measures the quantitative intensity of the questions external analysts ask on a call and expresses it relative to earlier calls in the same sector. A call's score is carried forward unchanged for up to 90 days. Details are in the ECQDI paper.
Missing scores
A stock can have one score, both or neither on a given date. A missing score is not a negative view. In the main application a stock without a score is not ranked on that factor and receives no penalty from it. The calculation of both scores remains proprietary.
04Three baselines, one portfolio rule
The factors are tested as overlays. Each baseline ranks the same stocks on its own; the paired portfolio uses the same ranking and lets the factors change selection priority. Dates, capital, execution and costs are identical within each pair.
Custom Qlib model
Microsoft's Qlib framework [1] supplies 157 price and volume features. LightGBM [3] learns from them to rank stocks by their expected return over the following 42 sessions. The model is refitted once a year on an expanding history, using only outcomes completed before the test year, with four fixed training seeds. It receives no factor input.
Qlib reference model
The second baseline uses Qlib's published feature set and LightGBM configuration with its original next-day target and published hyperparameters, adapted to US stocks. It is a model specification we did not design ourselves. It is also fitted once a year with the same four seeds and receives no factor input.
Momentum
The third baseline needs no model. Stocks are ranked by their return from 252 to 21 sessions before the decision, the standard twelve-month momentum that skips the latest month. It gives one deterministic ranking per date.
One portfolio rule for all three
- Portfolio: 50 equally weighted long positions across 95% of USD 1 million.
- Decisions: weekly, executed at the opening price, using rankings from the preceding close.
- Costs: 10 bp on every executed buy and sell.
- Policies: buy & hold keeps the initial positions; weekly rebalancing repeats the selection each week.
- Horizons: 3, 6 and 12 calendar months, measured for a new portfolio pair started in each of the 245 weeks.
Results are paired differences: the return of the portfolio with both factors minus the return of its baseline, in basis points. For the two Qlib models the four seeds are averaged within each starting week. Each 95% interval comes from 5,000 circular-block bootstrap resamples of the starting weeks.
05What we investigated, in order
The application in this paper is the end of a sequence of investigations on the same history. This section lists every step in the order it was carried out, with its main result, including the results that were weak or unfavourable. The full tables are documented in separate research notes.
Each factor on its own
Both factors were first studied separately. On the full universe each made a small and uneven contribution. Among the most volatile fifth of stocks, ECPND improved all three baselines. ECQDI improved portfolios built on Qlib models, most clearly the reference model, and made no contribution with momentum.
Do the two scores say the same thing?
Across the 245 weekly formations, the rank correlation between the two scores averages +0.077; inside the most volatile fifth it is +0.11. They rank stocks differently, which makes a combination worth examining. A low correlation does not show that the second score adds return.
First combinations on daily accounts
The first combinations used a published Qlib model and momentum with daily trading from 2023. An equal blend of both scores raised the Qlib accounts from 10.4% to 12.4% a year, and a rule that penalized stocks flagged by either score raised them to 16.0%. Neither beat a control that used ECPND alone to flag the same number of stocks (16.1%). Momentum fell slightly under both rules.
Rules, weights and thresholds on the common panel
All combinations were then rerun on the common weekly panel from January 2022: a rule that gives lower priority when either score is weak (OR), a rule that requires both to be weak (AND), and rank blends with ECPND weights of 25%, 50% and 75%, each over thresholds from 0% to 100% and across 20 volatility settings. At 20% in the most volatile fifth, the OR rule produced the largest contributions for both Qlib models; the AND rule flags few stocks and contributed less.
Against each factor alone, and against a count-matched control
The OR rule was compared directly with each single factor and with a control that flags the same number of stocks using ECPND alone. These comparisons are part of the results in Section 7. Further controls reran the comparison with costs of 0, 10, 25 and 50 bp and with stocks that have both scores.
The resulting application
The application presented here is the OR rule at 20% among the most volatile fifth of stocks over 63 sessions. It was chosen after seeing historical results. Section 10 states what follows from that.
06Both factors inside the volatility filter
The application has two steps at every weekly decision. The volatility filter defines the pool; both factors then change priority inside that pool. Baseline and factor portfolio always use the same filtered pool.
- Measure volatility. For each eligible stock, take the 63 daily returns ending at the preceding close and annualize their standard deviation. Nothing from the decision day or later is used.
- Keep the most volatile fifth. Rank all eligible stocks by this value and keep those above the 80th percentile. The pool has 91 to 100 stocks per week, out of 453 to 497 eligible stocks.
- Rank each factor inside the pool. A stock receives lower priority when its ECPND score or its ECQDI score is in the lowest 20% of the pool. A missing score gives no penalty on that factor.
- Select 50 stocks. Order the stocks without a penalty by the baseline ranking, followed by the penalized stocks in the same order, and take the first 50. The baseline portfolio takes the first 50 of the pool without any penalty.
Both factors are applied at the same time, not one after the other. Because a stock is penalized when either score is weak, the rule can affect more than 20% of the pool. That is why Section 7 also compares it with a rule that penalizes the same number of stocks using one factor only.
07Portfolio results
Across three baselines, two policies and three horizons, 17 of 18 mean return differences are positive, and 8 have a 95% interval above zero.
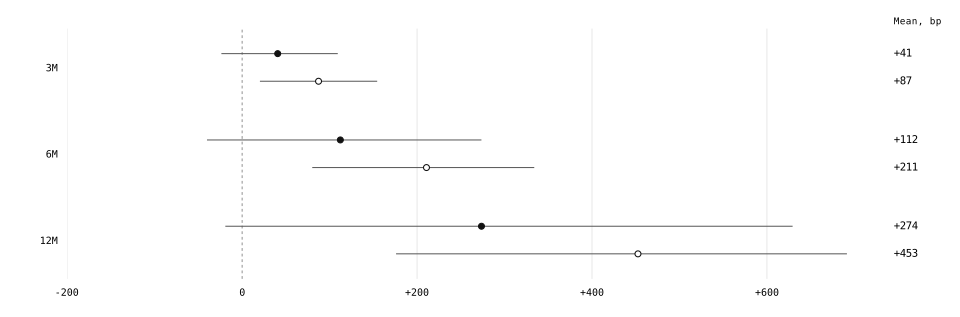
On average over the whole tested period and across the three baselines, both factors together added +41 bp, +112 bp and +274 bp with buy & hold and +87 bp, +211 bp and +453 bp with weekly rebalancing over 3, 6 and 12 months. With weekly rebalancing all three uncertainty ranges lie entirely in positive territory. With buy & hold the means are positive, but the ranges include zero.
| Baseline and policy | 3 months, bp | 95% interval | 6 months, bp | 95% interval | 12 months, bp | 95% interval |
|---|---|---|---|---|---|---|
| Custom Qlib · Buy & hold | +45 | -28 to +121 | +150 | -10 to +320 | +265 | +49 to +502 |
| Custom Qlib · Weekly rebalance | +75 | -7 to +154 | +178 | +41 to +313 | +348 | +44 to +598 |
| Qlib reference · Buy & hold | +86 | +12 to +166 | +163 | -8 to +341 | +358 | +68 to +740 |
| Qlib reference · Weekly rebalance | +157 | +67 to +246 | +359 | +188 to +515 | +771 | +432 to +1070 |
| Momentum · Buy & hold | -9 | -83 to +71 | +23 | -126 to +185 | +199 | -206 to +663 |
| Momentum · Weekly rebalance | +30 | -34 to +95 | +95 | -44 to +242 | +239 | -48 to +518 |
| Three-baseline average · Buy & hold | +41 | -24 to +109 | +112 | -40 to +274 | +274 | -19 to +629 |
| Three-baseline average · Weekly rebalance | +87 | +20 to +154 | +211 | +80 to +334 | +453 | +176 to +691 |
Mean return difference in basis points with its 95% interval. 17 of the 18 individual means are positive; in 8 of them, and in three of the six averages, the interval lies above zero. Completed starting weeks: 232, 219 and 193.
The contribution is largest for the two Qlib models. With the reference model and weekly rebalancing, both factors together added +359 bp over six months and +771 bp over twelve. With momentum the means are smaller, and the three-month buy & hold difference is negative.
Testing 18 comparisons at once raises the chance that some look significant by accident. After a Holm correction across all 18, three remain significant at the 5% level: the three horizons of the Qlib reference model with weekly rebalancing.
Compared with each factor alone
| Baseline and policy | 6 months: ECPND | ECQDI | Both | 12 months: ECPND | ECQDI | Both |
|---|---|---|---|---|---|---|
| Custom Qlib · Buy & hold | +109 | +29 | +150 | +201 | +60 | +265 |
| Custom Qlib · Weekly rebalance | +119 | +21 | +178 | +227 | +63 | +348 |
| Qlib reference · Buy & hold | +104 | +53 | +163 | +218 | +92 | +358 |
| Qlib reference · Weekly rebalance | +173 | +153 | +359 | +363 | +327 | +771 |
| Momentum · Buy & hold | +28 | -7 | +23 | +97 | +77 | +199 |
| Momentum · Weekly rebalance | +98 | +38 | +95 | +250 | +104 | +239 |
Each single factor uses its own 20% rule in the same filtered pool. Both: lower priority when either score is in the lowest 20%.
With the two Qlib models, both factors together added more than ECPND alone in all 12 comparisons and more than ECQDI alone in every one. With momentum, the joint rule exceeded ECPND alone in only one of six: adding ECQDI to a momentum ranking did not help, as in the ECQDI paper. Across all 18 comparisons the joint rule was ahead of ECPND alone in 13 and ahead of ECQDI alone in 17; after a Holm correction, 2 and 5 of these differences remain significant.
Is it a second source of information?
The joint rule penalizes more stocks than a single 20% rule. To separate the effect of a second score from the effect of a stricter rule, a control penalizes exactly as many stocks using ECPND alone. Against this control the joint rule was ahead in only 6 of 18 comparisons, and none of the differences is significant. The gain over a single factor can therefore not be attributed to ECQDI as a second source of information; a stricter ECPND rule did about as well.
Every difference is measured against a baseline that draws from the same filtered pool. It isolates what changes when the factors are added, not the return from choosing volatile stocks.
08Continuous accounts
The cohort results average many overlapping portfolios. A continuous account is the simpler view: one account per baseline, funded once in January 2022 and run until September 2026, rebalanced every week, every month or every quarter.
| Baseline and rebalancing | Growth p.a. | ECPND alone | ECQDI alone | Both | Difference | Seeds improved |
|---|---|---|---|---|---|---|
| Custom Qlib · Weekly | 13.1% | 15.6% | 12.6% | 15.8% | +2.7 pp | 4 of 4 |
| Custom Qlib · Monthly | 13.2% | 15.6% | 12.9% | 16.1% | +2.9 pp | 4 of 4 |
| Custom Qlib · Quarterly | 13.7% | 15.5% | 15.1% | 17.6% | +3.8 pp | 4 of 4 |
| Qlib reference · Weekly | 8.8% | 12.4% | 11.1% | 14.8% | +6.0 pp | 4 of 4 |
| Qlib reference · Monthly | 13.5% | 16.3% | 13.8% | 16.7% | +3.2 pp | 4 of 4 |
| Qlib reference · Quarterly | 14.9% | 17.7% | 15.6% | 18.9% | +4.0 pp | 4 of 4 |
| Momentum · Weekly | 17.9% | 20.1% | 17.9% | 19.0% | +1.1 pp | 1 of 1 |
| Momentum · Monthly | 18.0% | 19.1% | 17.2% | 16.8% | -1.2 pp | 0 of 1 |
| Momentum · Quarterly | 19.3% | 21.1% | 20.5% | 19.8% | +0.5 pp | 1 of 1 |
Growth per year of the baseline account, with each single factor and with both. Difference: both factors minus baseline. Qlib rows are means of four seed accounts; momentum is one account pair. All accounts start on 10 January 2022 and include all fees.
With the two Qlib models, both factors together raised the annual growth rate in all six accounts, by between 2.7 and 6.0 percentage points, and all four seeds improved in each. In all six, the joint rule also grew faster than either factor alone. With momentum the picture is mixed: growth rose with weekly and quarterly rebalancing and fell with monthly rebalancing, and ECPND alone did better at every frequency.
These are single historical paths over one market period, all started on 10 January 2022; other starting dates may give different results. They include all fees and are not averages of the cohorts in Section 7.
09Stability across years and volatility
This section looks at how the contribution is spread across starting years, and how it changes with the volatility of the stocks.
Across starting years
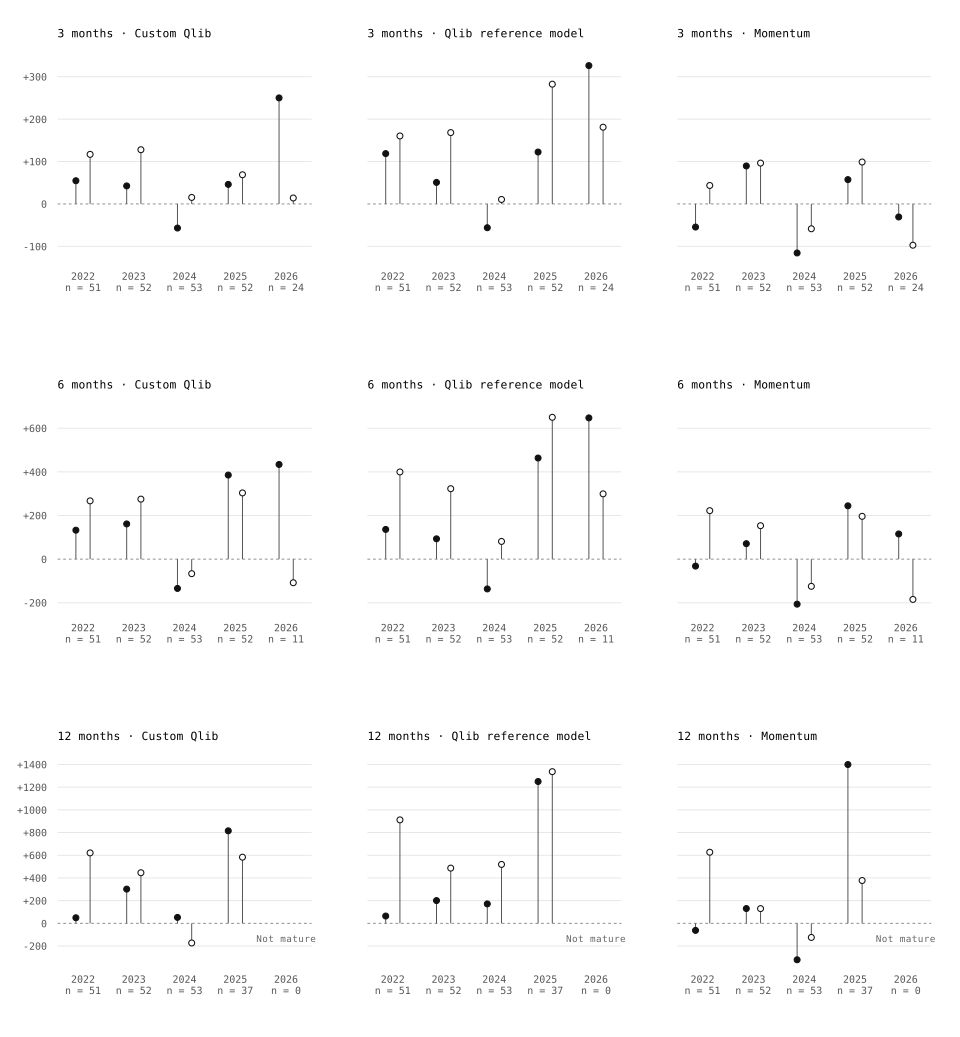
Figure 2 groups the portfolios by the year in which they were started. Of 84 year groups across all baselines, policies and horizons, 65 are positive. Of the 19 negative groups, 12 belong to momentum, 5 to the custom model and 2 to the reference model.
Scales differ between horizons. Year groups that have not yet completed a horizon are left out, and the 2026 groups contain only 24 starting weeks at three months and 11 at six months.
Across volatility
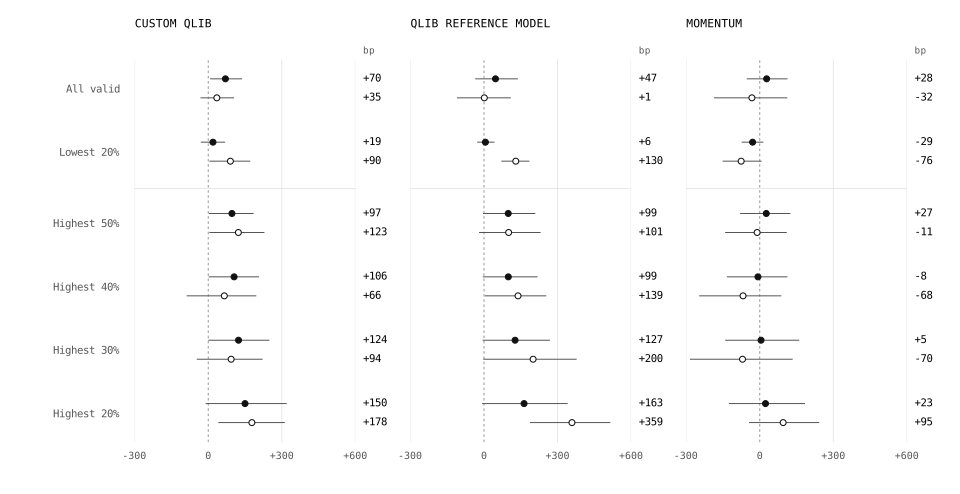
Figure 3 applies the same joint rule to pools of different volatility.
| Baseline and policy | 3 months, bp | Holm p | 6 months, bp | Holm p | 12 months, bp | Holm p |
|---|---|---|---|---|---|---|
| Custom Qlib · Buy & hold | +43 | 1.000 | +131 | 0.712 | +251 | 0.007 |
| Custom Qlib · Weekly rebalance | +39 | 1.000 | +88 | 1.000 | +124 | 1.000 |
| Qlib reference · Buy & hold | +94 | 0.226 | +158 | 0.592 | +358 | 0.165 |
| Qlib reference · Weekly rebalance | +95 | 0.394 | +229 | 0.058 | +482 | 0.058 |
| Momentum · Buy & hold | +16 | 1.000 | +53 | 1.000 | +244 | 1.000 |
| Momentum · Weekly rebalance | +70 | 0.592 | +171 | 0.317 | +413 | 0.031 |
Difference between the joint contribution in the two pools, in basis points, with its Holm-adjusted p-value across the 18 comparisons. All 18 differences are positive; 2 have a Holm p-value below 0.05.
Table 5 compares the most volatile fifth with the least volatile fifth week by week. The contribution is larger in the most volatile fifth in all 18 comparisons, and 2 of them remain significant after a Holm correction. This compares two different stock pools: it shows where the factors contributed, not that volatility causes the contribution.
10What the result does not show
- No proof of complementarity. The joint rule beats each single 20% rule on average, but not an ECPND-only rule that penalizes the same number of stocks. The data do not show that the second factor adds information.
- Model-dependent. The joint rule is strongest with the two Qlib models. With momentum it does not improve on ECPND alone. After a Holm correction, only the three comparisons of the Qlib reference model with weekly rebalancing remain significant.
- Chosen in hindsight. The rule, the 20% threshold and the volatility filter were selected after reviewing results on this same history, from a grid of rules, weights and thresholds. The intervals in Section 7 are not corrected for that search.
- One market period. The study covers January 2022 to September 2026. The 245 weekly starts overlap heavily and share one market history; they are not independent experiments.
- A narrow, volatile pool. The application selects 50 of roughly 96 highly volatile large-cap stocks. Capacity, spreads and market impact are not modelled beyond the flat 10 bp cost.
Evidence on new data comes from the forward evaluation, which records delivered scores and portfolio decisions as they happen.
11Research records and further papers
A separate internal recalculation reproduced every cohort summary and every continuous account path of the combination study and reconciled the single-factor results with the individual studies. This verifies the arithmetic; it is not an external audit of the price data.
The research package is deliberately small. It contains two years of daily scores for both factors, released with a six-month delay, one worked selection example that shows each stock's volatility next to both scores, and a README. These scores are shorter than the study history and do not reproduce it in full. The calculation of both scores remains proprietary. The detailed study records are kept in our research archive.
Each factor is presented on its own in the ECPND paper and the ECQDI paper.
-References
- Yang, X., Liu, W., Zhou, D., Bian, J. & Liu, T.-Y. (2020). Qlib: An AI-oriented Quantitative Investment Platform. arXiv:2009.11189. Official Microsoft repository.
- Microsoft Qlib. Alpha158 data handler and feature-processing implementation. Source documentation for the price and volume feature family used by the baseline.
- Ke, G., Meng, Q., Finley, T., Wang, T., Chen, W., Ma, W., Ye, Q. & Liu, T.-Y. (2017). LightGBM: A Highly Efficient Gradient Boosting Decision Tree. Advances in Neural Information Processing Systems 30.
- Politis, D. N. & Romano, J. P. (1991). A Circular Block-Resampling Procedure for Stationary Data. Stanford Department of Statistics, technical report EFS NSF 370. The block lengths and resampling count in this study are implementation choices.
- French, K. R. Data Library. Daily US Fama-French three- and five-factor research returns and momentum returns. Frozen files used in the supplementary validation have a common cut-off of 31 August 2026.
- Newey, W. K. & West, K. D. (1987). A Simple, Positive Semi-Definite, Heteroskedasticity and Autocorrelation Consistent Covariance Matrix. Econometrica, 55(3), 703-708. NBER working-paper version.
- Microsoft Qlib (v0.9.7). LightGBM / Alpha158 benchmark configuration. Published model parameters and TopkDropout settings. Accessed 2 October 2026. Our US inputs, training windows and execution assumptions are specified in Section 4.
- French, K. R. Detail for Monthly Momentum Factor (Mom). Prior months 2-12 convention. Accessed 2 October 2026. Our weekly, long-only momentum portfolio is a separate implementation.
- Holm, S. (1979). A Simple Sequentially Rejective Multiple Test Procedure. Scandinavian Journal of Statistics, 6(2), 65-70.