01Quantitative questioning as a source of information
An analyst’s question can connect reported results with the assumptions behind an investment view. ECQDI examines the quantitative character of those questions.
External analysts bring company knowledge, sector expertise and financial models to the call. A question about an operating measure, a forecast assumption or the relationship between reported figures may reflect work completed before the conversation begins. These contributions provide an observable record of the issues that informed participants choose to examine.
The research rationale is that this record may contain information beyond historical prices and trading volumes. Quantitative questioning could indicate close scrutiny of a company’s operating outlook or an effort to resolve uncertainty in an existing model. It can also accompany concern, disagreement or unusually complex reporting. The interpretation therefore needs to be tested against subsequent outcomes.
Related research supports examining analyst contributions. Mayew, Sharp and Venkatachalam find that participating analysts issue more accurate and timely forecasts immediately after calls than nonparticipants [1]. Rennekamp, Sethuraman and Steenhoven study conversational engagement between managers and analysts as an informative characteristic of the interaction [2]. These findings motivate attention to questioning and conversation; they do not establish the return contribution of ECQDI.
Quantitative dynamics and intensity describes the factor’s perspective. Intensity concerns the quantitative character of external analyst contributions. Dynamics concerns how successive observations differ within an evolving historical reference. The current score is a deterministic call measurement expressed relative to earlier sector peers. It does not separately estimate sentiment, research quality or the speed of change between calls.
02Data, universe and timing
The study joins an earnings-call score history with frozen stock rankings and adjusted prices. Each observation enters only under the declared timing rules.
The recovered ECQDI archive contains 78,851 calls from 3,722 tickers and reproduces 48,701 stored version-2 scores. The portfolio history uses a stricter chronological reference that excludes all other calls on the same date, yielding 48,689 scored calls. This removes dependence on within-day processing order while retaining the same text measurement. The counts describe the source archive, not the investable panel or independent investment experiments.
On every decision date, all three rankings use the intersection of stocks with forecasts from both Qlib models, sufficient earlier prices for momentum and a valid opening execution price. A missing ECQDI value does not remove a candidate in the main test. Both arms begin with that same dated pool; the scored-only and volatility controls narrow both arms together.
| Input | Coverage | Role |
|---|---|---|
| Call archive | 78,851 calls · 3,722 tickers | Source observations for the text measurement and historical sector comparison. |
| Chronological scores | 48,689 scored calls | Strict prior-date sector reference; separate from 48,701 production-order replay scores. |
| Common panel | 541 tickers · 453-497 per week | Intersection of both model panels, momentum history and valid execution prices. |
| Score coverage | 91.26% · 106,691 / 116,903 | Unique weekly ticker-date candidates, without repeated model-seed rows. |
| Weekly starts | 245 · 10 Jan 2022-14 Sept 2026 | 232, 219 and 193 completed formations at 3, 6 and 12 months. |
| Price cut-off | 18 Sept 2026 | Frozen adjusted USD opening and closing prices; determines horizon maturity. |
The research universe
S&P 500 membership snapshots provide a reference for the model-eligible US equity panel. Membership and data eligibility vary by date. This is not a claim to cover every US stock or a fully verified historical index panel. Historical membership, delisting coverage and adjusted-price anomalies remain relevant to interpretation and independent validation.
Two clocks: observation and execution
- Call observation: Calculate the call score using earlier eligible sector observations and prior price information.
- Next session: Only a scored call from an earlier calendar date can supply the opening decision’s value.
- Weekly decision: Join that eligible score with the preceding close’s ranking, then trade at the weekly opening.
A Friday call can inform Monday’s decision if Monday is a US trading session. A Tuesday call can become eligible on Wednesday, but the weekly strategy waits for its next scheduled decision. Holidays move the decision to the next available session. The score remains eligible through day 90 after its call date; it is missing from day 91 unless a newer eligible scored call exists.
Historical and live availability. Historical eligibility follows this date convention. For live use, save the delivered snapshot and respect its actual publication time, version and data status. An hourly update check is a delivery process, not an hourly trading requirement. The historical weekly test does not establish that every archived transcript revision was available at a specific intraday time.
03From a call to ECQDI
ECQDI expresses a call’s quantitative questioning relative to its sector history, in a form that can be joined to an equity panel by date and ticker.
- Observe: Identify external analysts’ contributions in the structured question-and-answer record.
- Measure: Apply the same deterministic text measurement to each eligible call.
- Contextualize: Compare the observation with earlier calls in its historical sector reference.
- Evaluate: Apply the supplied score to a fixed selection rule and compare matched portfolios.
The measurement uses external analyst contributions. Management’s prepared remarks and answers are excluded. Fixed extraction rules make the calculation repeatable without fitting a language model, retraining predictive text weights or assigning a sentiment label to each new call.
The reference covers the preceding 365 calendar days and requires at least eight usable calls in the same sector. A score of 0.80 means that 80% of those reference observations have a strictly lower measurement. Equal measurements are not counted as lower. This expresses the call’s relative position; it is neither an 80% probability of a price rise nor a forecast of the company’s earnings.
- Field:
ecqdi_score, a supplied value between 0 and 1. - Direction: Higher values indicate greater relative quantitative intensity.
- Persistence: A call’s score is carried forward unchanged while it remains eligible.
- Expiry: The study accepts call ages of 1-90 calendar days at the decision date.
- Missing score: No eligible value for that stock and date; zero remains a valid score.
Daily availability and expiry
The date in the daily sample identifies the decision session for which the supplied value is eligible. Its underlying call can be older: a call from three weeks earlier may still support today’s value. ECQDI retains the sector context from the call date. It does not re-rank that same call every morning as other companies report.
The portfolio uses the latest eligible scored call before its decision date. A newer scored call replaces it. A later call that has no eligible score does not itself replace the earlier scored observation. The prior value remains usable only through day 90 after its own call date; day 91 is outside the study’s freshness window. Carrying the value into another daily row does not reset its age.
Use the value supplied for the decision date. The score CSV already applies the call-date ordering and expiry rules, so an additional day of delay is unnecessary. A blank should remain missing. In buy & hold, subsequent score expiry alone does not trigger a sale; weekly rebalancing uses the eligible observations at each new decision.
What a missing score means
- No earlier scored call: No eligible scored observation precedes the decision date.
- Unusable input: The required measurement or sector information is unavailable.
- Insufficient peers: Fewer than eight usable sector calls are available in the reference window.
- Liquidity eligibility: Earlier price observations are insufficient or the liquidity floor is unmet.
- Expired observation: The latest eligible scored call is more than 90 calendar days old.
These conditions explain why a current value may be unavailable. An ineligible new call can coexist with an older, still-valid score. The primary portfolio keeps stocks with missing values eligible under the model ranking and gives them no score penalty. The scored-only control removes them from both arms before selection. Missingness is an eligibility state, not a positive or negative investment view.
Scope of disclosure. This note documents the rationale, inputs, reference window, timing and portfolio application. The exact extraction rules, normalization and raw measurement remain proprietary. The supplied score and the rule in Section 6 allow researchers to test its usefulness without reconstructing the text-measurement engine.
04Three baselines, one portfolio rule
ECQDI is tested as an overlay. Two Qlib models provide the rankings it is meant to complement; momentum is a third, model-free ranking that serves as a contrast. Each baseline ranks the same stocks on its own; the paired portfolio uses the same ranking and lets ECQDI change selection priority. Dates, capital, execution and costs are identical within each pair.
Custom Qlib model
Microsoft's Qlib framework [3] supplies 157 price and volume features. LightGBM [5] learns from them to rank stocks by their expected return over the following 42 sessions. The model is refitted once a year on an expanding history, using only outcomes completed before the test year, with four fixed training seeds. It receives no ECQDI input.
Qlib reference model
The second baseline uses Qlib's published feature set and LightGBM configuration with its original next-day target and published hyperparameters, adapted to US stocks. It is a model specification we did not design ourselves. It is also fitted once a year with the same four seeds and receives no ECQDI input.
Momentum
The third baseline needs no model. Stocks are ranked by their return from 252 to 21 sessions before the decision, the standard twelve-month momentum that skips the latest month. It gives one deterministic ranking per date and asks whether the text factor adds value beyond a simple price rule.
One portfolio rule for all three
- Portfolio: 50 equally weighted long positions across 95% of USD 1 million.
- Decisions: weekly, executed at the opening price, using rankings from the preceding close.
- Costs: 10 bp on every executed buy and sell.
- Policies: buy & hold keeps the initial positions; weekly rebalancing repeats the selection each week.
- Horizons: 3, 6 and 12 calendar months, measured for a new portfolio pair started in each of the 245 weeks.
Results are paired differences: the return of the portfolio with ECQDI minus the return of its baseline, in basis points. For the two Qlib models the four seeds are averaged within each starting week. Each 95% interval comes from 5,000 circular-block bootstrap resamples of the starting weeks.
05What we investigated, in order
The application in this paper is the end of a sequence of investigations on the same history. This section lists every step in the order it was carried out, with its main result, including the results that were weak or unfavourable. The full tables are documented in separate research notes.
The measurement at call level
The factor began as a measurement of individual calls. In US stocks, its rank correlation with returns over the following 63 days was +0.032 with a t-statistic of 3.5. The same measurement on 63,903 calls from 13 other markets did not confirm this: the correlation was close to zero and positive in only 6 of 13 markets.
The score in the portfolio universe
Carried into the weekly stock universe of this study, the rank correlation between score and later return was +0.017 over 63 sessions, with a p-value of 0.11; no horizon was statistically significant. A portfolio selected by score alone grew by 8.9% a year after costs. Regressions on the standard equity factors found no significant alpha.
First portfolio applications
On a single model seed, the 20% rule raised the growth of the custom Qlib account from 8.0% to 8.4% a year, while momentum fell from 21.0% to 18.1%. With a published Qlib model and daily trading from 2023, the rule raised growth from 10.6% to 12.6% a year, and a 60% rule to 13.2%; momentum under the same rules fell from 26.8% to 25.6% and 22.5%. From the start, ECQDI helped the Qlib models and hurt momentum.
Three baselines under one protocol
All three baselines were then rerun on identical stocks, dates and weekly rules from January 2022, over every threshold from 0% to 100%. At 20%, six-month buy & hold portfolios changed by +28 bp, +27 bp and -3 bp against the custom, reference and momentum baselines, and 8 of 18 mean differences were positive. No comparison remained significant after a Holm correction or after a correction across the threshold grid. Continuous weekly accounts lost ground: -237 bp, -149 bp and -908 bp of total return.
Costs, missing scores and rebalancing
Further controls varied trading costs between 0 and 50 bp and restricted both portfolios to stocks with a score. Neither changed the picture: buy & hold on the two Qlib models stayed slightly positive, momentum stayed negative. Quarterly, half-yearly and yearly rebalancing with staggered starts were also examined.
Momentum of connected companies
After controlling for a stock's own momentum and the momentum of companies linked through shared analysts, the score's three-month rank relationship with returns was +0.015 with a p-value of 0.16: positive, not significant.
Where is the contribution concentrated?
Finally we asked whether the contribution differs with a stock's recent volatility, using the same 20 settings as for our participation factor. The factor contributed more in the most volatile fifth than in the least volatile fifth in 14 of 18 comparisons, but none of these differences is statistically significant (Section 9).
The resulting application
Across these steps one pattern repeats: ECQDI adds to rankings produced by a Qlib model and does not add to a momentum ranking. This paper therefore presents ECQDI as a complement to model-based rankings, using the 20% rule among the most volatile fifth of stocks over 63 sessions, and reports momentum alongside as the case where it does not help. These choices were made after seeing historical results. Section 10 states what follows from that.
06The 20% rule inside the volatility filter
The application has two steps at every weekly decision. The volatility filter defines the pool; ECQDI then changes priority inside that pool. Baseline and factor portfolio always use the same filtered pool.
- Measure volatility. For each eligible stock, take the 63 daily returns ending at the preceding close and annualize their standard deviation. Nothing from the decision day or later is used.
- Keep the most volatile fifth. Rank all eligible stocks by this value and keep those above the 80th percentile. The pool has 91 to 100 stocks per week, out of 453 to 497 eligible stocks.
- Rank ECQDI inside the pool. Stocks whose score is in the lowest 20% of the pool receive lower priority. Stocks without a score, on average 8 per week, receive no penalty.
- Select 50 stocks. Order the stocks without a penalty by the baseline ranking, followed by the penalized stocks in the same order, and take the first 50. The baseline portfolio takes the first 50 of the pool without any penalty.
The factor does not pick stocks on its own. It removes weakly scored candidates from the front of a ranking the baseline has already made. Because the pool holds roughly twice as many stocks as the portfolio, the 20% rule typically replaces a handful of the 50 positions.
07Portfolio results
With the two Qlib models, 11 of 12 mean return differences are positive. The contribution is clear for the Qlib reference model with weekly rebalancing and smaller and less certain for the custom model.
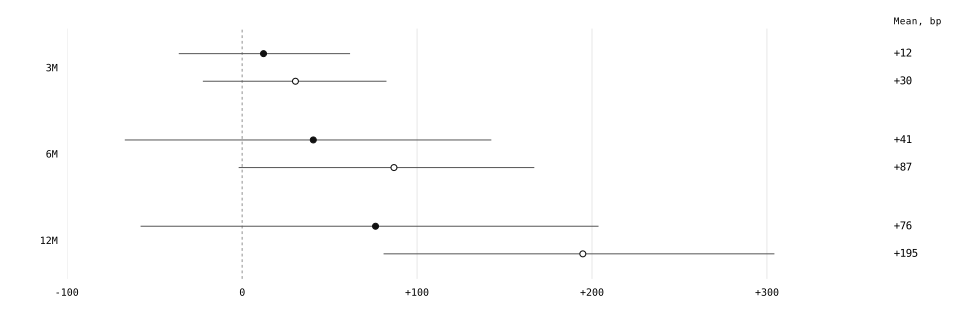
On average over the whole tested period and across the two Qlib models, ECQDI added +12 bp, +41 bp and +76 bp with buy & hold and +30 bp, +87 bp and +195 bp with weekly rebalancing over 3, 6 and 12 months. All six means are positive. The uncertainty range lies entirely in positive territory for twelve months with weekly rebalancing; the other five include zero, six months with weekly rebalancing only just.
| Baseline and policy | 3 months, bp | 95% interval | 6 months, bp | 95% interval | 12 months, bp | 95% interval |
|---|---|---|---|---|---|---|
| Custom Qlib · Buy & hold | +1 | -50 to +51 | +29 | -85 to +129 | +60 | -75 to +190 |
| Custom Qlib · Weekly rebalance | -3 | -63 to +53 | +21 | -71 to +106 | +63 | -75 to +199 |
| Qlib reference · Buy & hold | +24 | -25 to +74 | +53 | -56 to +156 | +92 | -42 to +232 |
| Qlib reference · Weekly rebalance | +64 | +4 to +125 | +153 | +39 to +262 | +327 | +137 to +533 |
| Two-model average · Buy & hold | +12 | -36 to +62 | +41 | -67 to +142 | +76 | -58 to +204 |
| Two-model average · Weekly rebalance | +30 | -22 to +83 | +87 | -2 to +167 | +195 | +81 to +304 |
Mean return difference in basis points with its 95% interval. 11 of the 12 individual means are positive; in 3 of them, all for the Qlib reference model with weekly rebalancing, the interval lies above zero. Completed starting weeks: 232, 219 and 193.
With the Qlib reference model and weekly rebalancing, ECQDI added +64 bp, +153 bp and +327 bp over 3, 6 and 12 months, each with an interval above zero. With buy & hold the same model gained less, and the intervals include zero. For the custom model all but one mean are positive, but none can be distinguished from zero.
After a Holm correction across all 18 comparisons, including momentum, one remains significant at the 5% level: the Qlib reference model with weekly rebalancing over twelve months.
Momentum: no contribution
| Baseline and policy | 3 months, bp | 95% interval | 6 months, bp | 95% interval | 12 months, bp | 95% interval |
|---|---|---|---|---|---|---|
| Momentum · Buy & hold | -6 | -56 to +48 | -7 | -110 to +109 | +77 | -159 to +338 |
| Momentum · Weekly rebalance | +9 | -49 to +68 | +38 | -61 to +135 | +104 | -68 to +249 |
Same rule, pool, costs and starting weeks as Table 2. Every interval includes zero.
Applied to a momentum ranking, the same rule shows no contribution. The means are small at three and six months, every interval includes zero, and the intervals are wide in both directions. This matches the earlier investigations in Section 5, where ECQDI consistently weakened momentum portfolios on the full universe.
Every difference is measured against a baseline that draws from the same filtered pool. It isolates what changes when ECQDI is added, not the return from choosing volatile stocks.
08Continuous accounts
The cohort results average many overlapping portfolios. A continuous account is the simpler view: one account per baseline, funded once in January 2022 and run until September 2026, rebalanced every week, every month or every quarter.
| Baseline and rebalancing | Growth p.a. | With ECQDI | Difference | Max. drawdown | With ECQDI | Seeds improved |
|---|---|---|---|---|---|---|
| Custom Qlib · Weekly | 13.1% | 12.6% | -0.5 pp | -28.9% | -30.3% | 1 of 4 |
| Custom Qlib · Monthly | 13.2% | 12.9% | -0.3 pp | -28.0% | -27.8% | 3 of 4 |
| Custom Qlib · Quarterly | 13.7% | 15.1% | +1.3 pp | -29.4% | -28.8% | 3 of 4 |
| Qlib reference · Weekly | 8.8% | 11.1% | +2.3 pp | -28.6% | -30.2% | 4 of 4 |
| Qlib reference · Monthly | 13.5% | 13.8% | +0.3 pp | -25.9% | -26.6% | 3 of 4 |
| Qlib reference · Quarterly | 14.9% | 15.6% | +0.7 pp | -26.8% | -26.3% | 3 of 4 |
| Momentum · Weekly | 17.9% | 17.9% | +0.0 pp | -25.9% | -26.1% | 1 of 1 |
| Momentum · Monthly | 18.0% | 17.2% | -0.8 pp | -26.2% | -26.3% | 0 of 1 |
| Momentum · Quarterly | 19.3% | 20.5% | +1.1 pp | -26.3% | -24.2% | 1 of 1 |
Qlib rows are means of four separately funded seed accounts; momentum is one account pair. All accounts start on 10 January 2022 and include all fees.
The Qlib reference model improved at all three rebalancing frequencies, most with weekly rebalancing (+2.3 pp), where all four seeds gained. The custom model lost slightly with weekly and monthly rebalancing and gained with quarterly rebalancing. For the two Qlib models together, four of six accounts improved. Momentum was unchanged with weekly rebalancing, lost with monthly and gained with quarterly rebalancing: no consistent contribution.
These are single historical paths over one market period, all started on 10 January 2022; other starting dates may give different results. They include all fees and are not averages of the cohorts in Section 7.
09Stability across years and volatility
This section looks at how the contribution is spread across starting years, and how it changes with the volatility of the stocks.
Across starting years
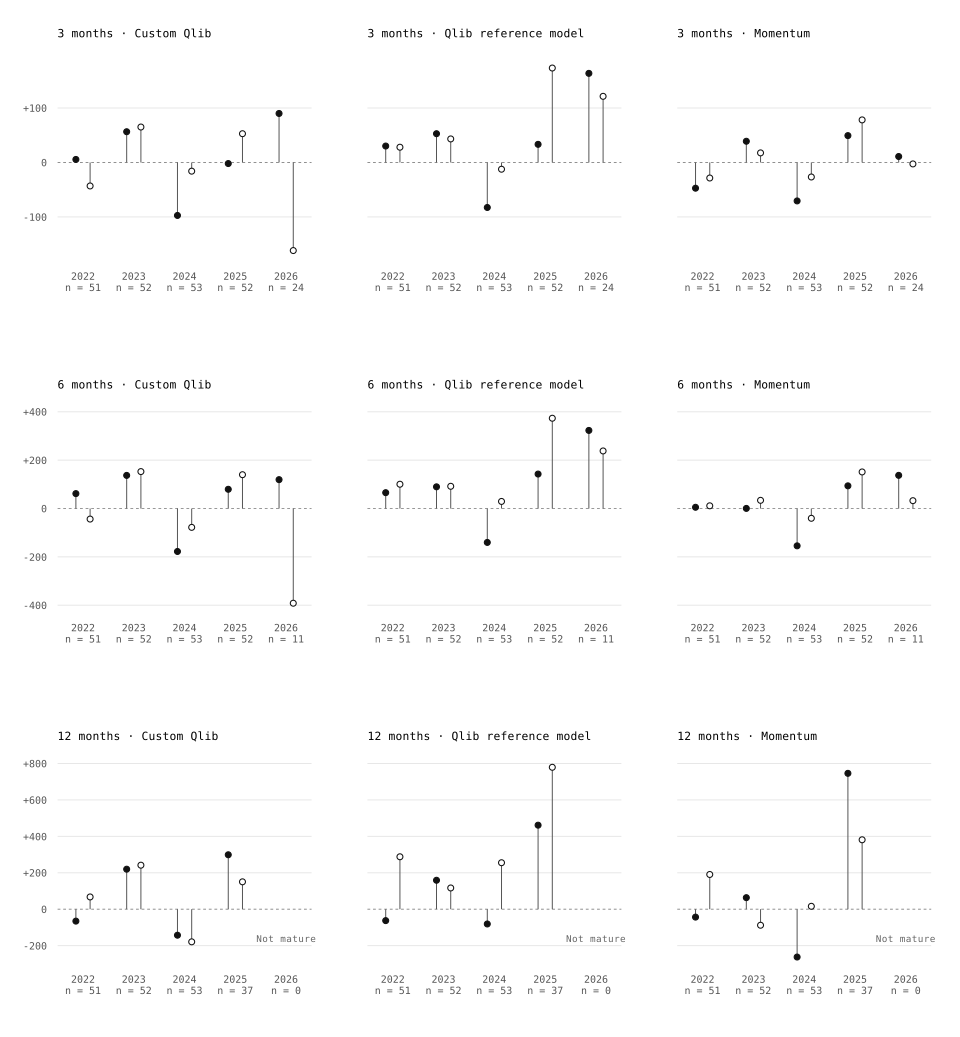
Figure 2 groups the portfolios by the year in which they were started. For the Qlib reference model, 23 of 28 year groups are positive; for the custom model, 16 of 28. The reference model's contribution is spread across the years, while the custom model changes sign more often. Momentum has 10 negative groups of 28.
Scales differ between horizons. Year groups that have not yet completed a horizon are left out, and the 2026 groups contain only 24 starting weeks at three months and 11 at six months.
Across volatility
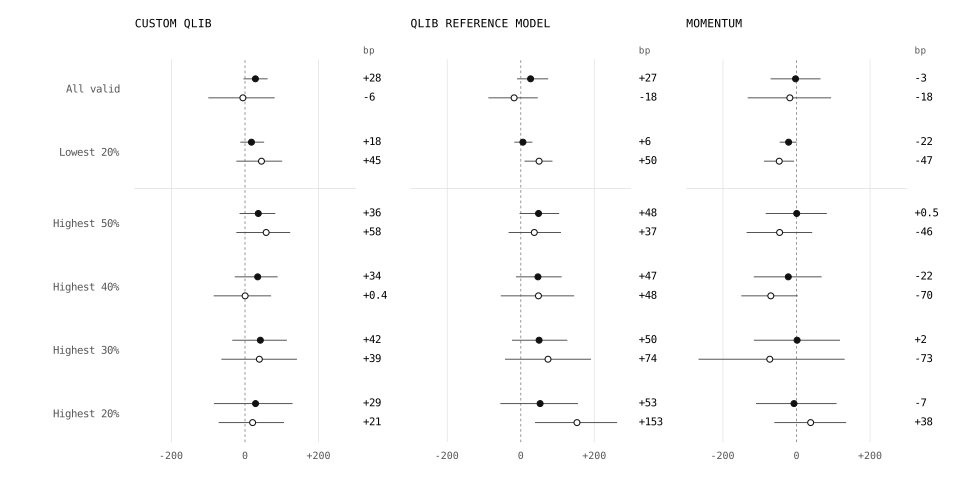
Figure 3 applies the same 20% rule to pools of different volatility.
| Baseline and policy | 3 months, bp | Holm p | 6 months, bp | Holm p | 12 months, bp | Holm p |
|---|---|---|---|---|---|---|
| Custom Qlib · Buy & hold | -6 | 1.000 | +11 | 1.000 | +39 | 1.000 |
| Custom Qlib · Weekly rebalance | -22 | 1.000 | -24 | 1.000 | -60 | 1.000 |
| Qlib reference · Buy & hold | +24 | 1.000 | +47 | 1.000 | +86 | 1.000 |
| Qlib reference · Weekly rebalance | +39 | 1.000 | +103 | 0.840 | +213 | 0.187 |
| Momentum · Buy & hold | +5 | 1.000 | +15 | 1.000 | +109 | 1.000 |
| Momentum · Weekly rebalance | +35 | 1.000 | +85 | 1.000 | +199 | 1.000 |
Difference between the ECQDI contribution in the two pools, in basis points, with its Holm-adjusted p-value across the 18 comparisons. 14 of 18 differences are positive; none has a Holm p-value below 0.05.
Table 5 compares the most volatile fifth with the least volatile fifth week by week. The contribution is larger in the most volatile fifth in 14 of 18 comparisons, but none of the differences remains significant after a Holm correction. The volatility filter helps ECQDI less clearly than it helps our participation factor.
10What the result does not show
- Model-dependent. The contribution is clear for one Qlib model with weekly rebalancing. For the custom model it is positive on average but not distinguishable from zero, and with momentum there is none. ECQDI is not a general improvement to any ranking.
- Chosen in hindsight. The 20% threshold, the volatility filter and the focus on Qlib models were selected after reviewing results on this same history. The intervals are not corrected for that search, so the clear results are weaker evidence than they look.
- One market period. The study covers January 2022 to September 2026. The 245 weekly starts overlap heavily and share one market history; they are not independent experiments.
- A narrow, volatile pool. The application selects 50 of roughly 96 highly volatile large-cap stocks. Capacity, spreads and market impact are not modelled beyond the flat 10 bp cost.
- Not confirmed elsewhere. The underlying measurement did not replicate in 13 non-US markets, and the score's own relationship with returns in this universe is not statistically significant.
Evidence on new data comes from the forward evaluation, which records delivered scores and portfolio decisions as they happen.
11Research records and further papers
A separate internal recalculation reproduced the cohort summaries, weekly selections and continuous accounts of the volatility study. This verifies the arithmetic; it is not an external audit of the price data.
The research package is deliberately small. It contains two years of daily scores for both factors, released with a six-month delay, one worked selection example that shows each stock's volatility next to both scores, and a README. These scores are shorter than the study history and do not reproduce it in full. The text measurement itself remains proprietary. The detailed study records are kept in our research archive.
The same application for our participation factor is presented in the ECPND paper; the combination of both factors is the subject of its own paper.
-References
- Mayew, W. J., Sharp, N. Y. & Venkatachalam, M. (2013). Using earnings conference calls to identify analysts with superior private information. Review of Accounting Studies, 18(2), 386-413. doi:10.1007/s11142-012-9210-y.
- Rennekamp, K. M., Sethuraman, M. & Steenhoven, B. A. (2022). Engagement in earnings conference calls. Journal of Accounting and Economics, 74(1), 101498. doi:10.1016/j.jacceco.2022.101498.
- Yang, X., Liu, W., Zhou, D., Bian, J. & Liu, T.-Y. (2020). Qlib: An AI-oriented Quantitative Investment Platform. arXiv:2009.11189. Official Microsoft repository.
- Microsoft Qlib. Alpha158 data handler. Official implementation and feature-processing interface. Accessed 25 September 2026. The study uses 157 available features from this family.
- Ke, G., Meng, Q., Finley, T., Wang, T., Chen, W., Ma, W., Ye, Q. & Liu, T.-Y. (2017). LightGBM: A Highly Efficient Gradient Boosting Decision Tree. Advances in Neural Information Processing Systems 30.
- Politis, D. N. & Romano, J. P. (1991). A Circular Block-Resampling Procedure for Stationary Data. Stanford Department of Statistics, technical report EFS NSF 370. The block lengths and resampling counts are this study’s implementation choices.
- Newey, W. K. & West, K. D. (1987). A Simple, Positive Semi-Definite, Heteroskedasticity and Autocorrelation Consistent Covariance Matrix. Econometrica, 55(3), 703-708. NBER working-paper version.
- French, K. R. Data Library. Daily US Fama-French three-factor, five-factor and momentum research returns, retrieved 2 October 2026. Used as reference series in Section 7; their inclusion does not validate or endorse ECQDI.
- Microsoft Qlib (v0.9.7). LightGBM / Alpha158 benchmark configuration. Published model parameters and TopkDropout settings. Accessed 2 October 2026. Our US inputs, training windows and execution assumptions are specified in the Section 4.2.
- French, K. R. Detail for Monthly Momentum Factor (Mom). Prior months 2-12 convention. Accessed 2 October 2026. Our weekly, long-only momentum portfolio is a separate implementation.
- Ali, U. & Hirshleifer, D. (2020). Shared analyst coverage: Unifying momentum spillover effects. Journal of Financial Economics, 136(3), 649-675. Our call-participation proxy is distinct from the paper’s analyst-coverage data.
- Holm, S. (1979). A Simple Sequentially Rejective Multiple Test Procedure. Scandinavian Journal of Statistics, 6(2), 65-70.