01Introduction
Who takes part in an earnings call is information in itself. External analysts decide which companies they follow and question, and those decisions reflect research, expectations and concerns formed long before the call. Because the same analysts recur across companies and quarters, their participation links companies into a network of professional attention. Earnings Call Participation Network and Dynamics (ECPND) measures the structure of this network and the way its connections form, persist and shift over time, and expresses the result as a daily score for US stocks.
The score is the subject of a continuing research programme at SGG Research. Our published study examines it as an overlay on existing stock rankings, where it improved matched portfolios in all 18 comparisons against three baseline models. A forward record with timestamped scores is being built to test these findings on new data.
That study always starts from a ranking model. This note removes the model. It asks how a portfolio performs when ECPND alone selects the stocks, and compares it with the simplest alternative an investor has: buying the S&P 500 and holding it.
02Construction
The experiment follows a single account from 10 January 2022 to 18 September 2026. Every quarter it repeats the same three steps, 19 times in total. The stock universe, the prices and the account rules are those of the published study; only the selection is new.
- Filter by volatility. We start from an S&P 500-based universe of 477 stocks on average. For every stock we measure how strongly its price moved over the prior 63 trading sessions, about three months, and keep the fifth with the highest volatility, 96 stocks on average. The published study found that ECPND contributes most among these stocks.
- Apply the score. Within the pool, the stocks are ordered by their ECPND score as it was available on that day. No price forecast, no model and no other factor enters the decision. The 50 stocks with the highest score are selected for the coming quarter; stocks without a score are placed last and are chosen only if fewer than 50 scored stocks remain.
- Trade. At the next market open the account sells what is no longer selected, buys what is new and adjusts the rest, so that all 50 stocks carry the same weight again. Each position then makes up 1.9% of the account. Until the next quarter nothing is traded, whatever happens to prices or scores in between.
The account starts with $1 million. It keeps 95% invested and 5% in cash, and pays 10 bp on the value of every purchase and every sale. Its value is recorded at each daily close.
The comparison is SPY, the largest fund tracking the S&P 500. It is bought once, at the open of the first day, and held to the end, with the same invested share and the same costs. The prices of SPY and of all stocks are adjusted for splits and dividends, so both accounts include reinvested dividends.
03Results
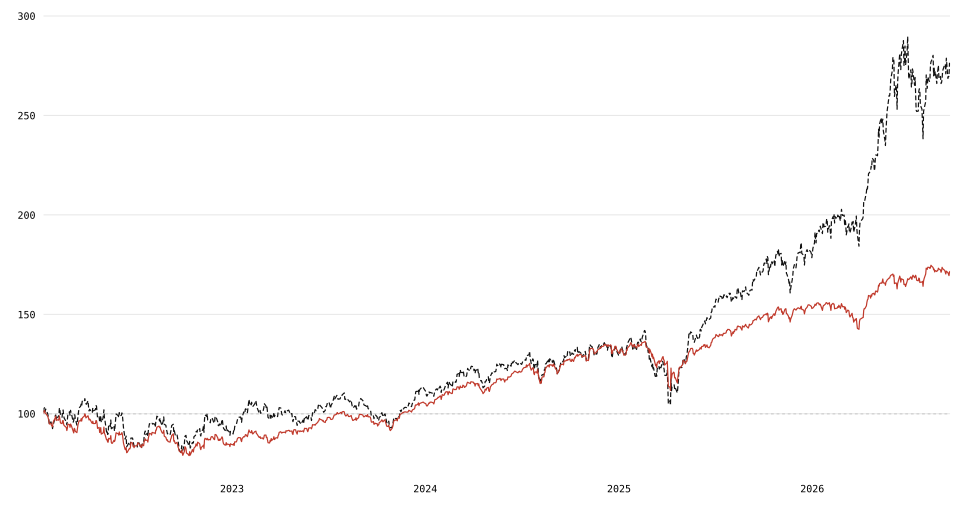
Figure 1 follows $100 in each account. Over the whole tested period it grew to $276 in the ECPND selection and to $172 in SPY. From 2022 to 2024 the selection outperformed almost continuously, but within a narrow range: it was ahead of SPY on 95% of all trading days, by 5.5% of the account value on average. Around the turn of 2024 to 2025 that margin closed for a few months. From spring 2025 the two accounts drifted apart, and by September 2026 the selection stood 61% above SPY.
Two properties of the score help to explain this drift. Its effect is larger when markets move more: in the more volatile half of the weeks, the selection gained +26 bp per week over the average stock of its pool, in the calmer half +13 bp. And a participation network is built from recurring observations. Connections have to form and persist over several quarters before their dynamics can be measured, and growing analyst attention to a group of companies adds observations and sharpens what the network shows.
The years 2025 and 2026 were led by technology stocks, and the score had positioned the selection there. Technology companies made up 53% of the selection in 2025 and 64% in 2026, against 31% and 43% of the pool, up from 41% of the selection in 2022. We read this as the network registering where professional attention was concentrating and the score following it. This is an interpretation of the path and not a tested result; Section 4 shows how much of the gain depends on this sector.
| Portfolio | Return p.a. | Total return | Largest loss | Volatility | Sharpe |
|---|---|---|---|---|---|
| ECPND selection | +24.2% | +176% | -26.5% | 27.0% | 0.93 |
| SPY, buy & hold | +12.2% | +72% | -22.3% | 16.6% | 0.77 |
The ECPND selection returned +24.2% per year against +12.2% for SPY. It did so with higher volatility (27.0% against 16.6%) and a deeper largest loss (-26.5% against -22.3%).
| Portfolio | 2022 | 2023 | 2024 | 2025 | 2026 to Sep |
|---|---|---|---|---|---|
| ECPND selection | -8.9% | +23.8% | +14.8% | +37.8% | +54.6% |
| SPY, buy & hold | -15.3% | +24.7% | +23.7% | +17.1% | +12.2% |
The selection finished ahead of SPY in 2022, 2025 and 2026 and behind it in 2023 and 2024.
Two controls put the result in context. Holding all stocks of the most volatile fifth, without any selection, returned +14.4% per year; the pool itself therefore explains part of the lead over SPY, and the score the rest. And of 200 random 50-stock portfolios drawn from the same pool, none returned as much as the ECPND selection: their median was +14.1% per year. The rebalancing rhythm made little difference, with +24.8% per year at weekly, +22.7% at monthly and +24.2% at quarterly rebalancing.
04Limits
To see where the result comes from, we compared the selection week by week with the average stock of its own pool, before costs. Among the most volatile fifth, the ECPND selection gained +20 bp per week over that average (t = 2.7). In the four calmer fifths of the universe the same selection added nothing measurable. The result therefore belongs to volatile stocks and should not be expected elsewhere. It was also uneven over time: the weekly gain was +8 bp in 2022-2023 and +28 bp in 2024-2026, and the first half is not distinguishable from zero on its own (t = 0.9).
The gain depended on the direction of the market. In weeks in which SPY rose, the selection gained +36 bp over its pool (t = 3.9); in weeks in which SPY fell, the difference was -3 bp. The score added return in rising markets and did not protect in falling ones. It also depended on one sector. Information technology supplies 30 of the 96 pool stocks on average, and without that sector the weekly gain falls to +5 bp (t = 1.7). A period in which technology stocks lag would test the selection in a way this history does not.
The portfolio is riskier than SPY, and part of its return is a reward for that risk. Its sensitivity to the market is 1.27, so it moves about a quarter more than the market in either direction, and it leans towards less profitable companies. Once the market, size, value, profitability, investment and momentum factors are accounted for, +6.9% per year remain. That remainder is positive but not distinguishable from zero (t = 1.4), which means the history is too short to separate the score from these known sources of return with confidence.
Finally, the design was chosen in hindsight. The volatility filter, the number of stocks and the period follow the published study, which was designed after reviewing historical results, and the tested period covers a single market cycle. The accounts assume execution at the next open and costs of 10 bp; market impact, taxes and capacity are not modelled. This note is a historical simulation and not a forward test. The forward record now being built will show whether the result holds on new data.