01Introduction
Who takes part in an earnings call is information in itself. External analysts decide which companies they follow and question, and because the same analysts recur across companies and quarters, their participation links companies into a network of professional attention. Earnings Call Participation Network and Dynamics (ECPND) measures the structure of this network and the way its connections form, persist and shift over time, and expresses the result as a daily score for US stocks. Our published study examines the score as an overlay on stock rankings; a second note lets it select stocks on its own among the most volatile fifth of the market.
That volatile selection earns its lead over the index with a portfolio that looks nothing like the index: fifty mid-sized, fast-moving stocks at equal weight, a market sensitivity well above one and a tracking error of around 15% per year. An investor who holds the S&P 500 and asks whether the score can improve on it needs a different construction. The portfolio has to hold the companies that make up the index, at weights close to the index, and it may deviate only where the score gives a reason. This note builds that portfolio and compares it with SPY.
02Construction
The experiment follows a single account from 10 January 2022 to 18 September 2026. Every quarter it repeats the same three steps, 19 times in total. The universe, the prices and the account rules are those of the published study; the share counts used for market capitalisation are a new input.
- Take the largest companies. We start from an S&P 500-based universe of 477 stocks on average. For each stock we compute its market capitalisation on the decision day from the share count last reported before that day and the opening price, and keep the 200 largest companies. These make up about nine tenths of the value of the whole universe.
- Apply the score. Within the 200, the stocks are ordered by their ECPND score as it was available on that day. No price forecast, no model and no other factor enters the decision. The 50 stocks with the highest score are selected for the coming quarter; stocks without a score cannot be selected.
- Weight and trade. The selected stocks are weighted by market capitalisation, so that the portfolio keeps the shape of the index. No stock may exceed 15% of the account; any excess is spread over the other holdings in proportion to their size. At the next market open the account sells what is no longer selected, buys what is new and adjusts the rest. Until the next quarter nothing is traded.
The account starts with $1 million, keeps 95% invested and 5% in cash, and pays 10 bp on the value of every purchase and every sale. Its value is recorded at each daily close. The comparison is SPY, bought once at the open of the first day and held to the end with the same invested share and the same costs. All prices are adjusted for splits and dividends, so both accounts include reinvested dividends. Share counts are taken from company filings as reported by Yahoo Finance and adjusted for the same splits as the prices.
03Results
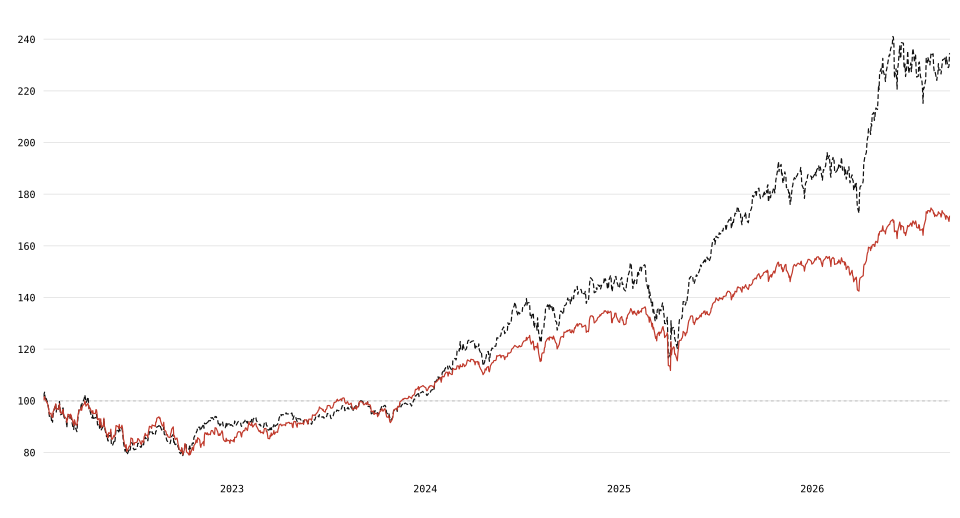
Figure 1 follows $100 in each account. The selection was ahead of SPY on 77% of all trading days since the start, but the lead was built in two stretches. It opened in 2022, when the selection moved out of technology during the year and fell less than the index, and it widened from 2024 onwards. In between, the selection gave back most of its advantage: measured against its own best relative level, it fell 12% behind SPY by July 2023. Over the first half of the period the selection returned +8.2% per year against +6.4% for SPY; over the second half +32.1% against +18.1%.
The holdings moved with the score. In October 2022 technology stocks made up 7% of the account, which then held oil, retail and pharmaceutical companies such as XOM, WMT, LLY, CVX; by July 2026 the technology share had risen to 72%, led by AAPL, NVDA, GOOGL, AVGO. The largest position reached the 15% cap at 16 of 19 rebalancings, usually Apple or NVIDIA. The portfolio is therefore not a fixed sector bet; it followed where the participation network registered growing professional attention, and in this period that path led from defensive large caps into technology.
| Portfolio | Return p.a. | Total return | Largest loss | Volatility | Sharpe |
|---|---|---|---|---|---|
| ECPND Large Cap 50 | +20.0% | +135% | -24.0% | 21.6% | 0.94 |
| SPY, buy & hold | +12.2% | +72% | -22.3% | 16.6% | 0.77 |
The selection returned +20.0% per year against +12.2% for SPY, with a largest loss of -24.0% against -22.3% and volatility of 21.6% against 16.6%.
| Portfolio | 2022 | 2023 | 2024 | 2025 | 2026 to Sep |
|---|---|---|---|---|---|
| ECPND Large Cap 50 | -9.2% | +13.6% | +39.2% | +29.1% | +26.5% |
| SPY, buy & hold | -15.3% | +24.7% | +23.7% | +17.1% | +12.2% |
The selection finished ahead of SPY in 2022, 2024, 2025 and 2026 and behind it in 2023, by 11 points.
| Portfolio | Return p.a. | Largest loss | Sharpe |
|---|---|---|---|
| 200 largest, capitalisation weighted | +13.4% | -22.9% | 0.82 |
| 200 largest, 50 weakest ECPND | +11.0% | -21.7% | 0.75 |
| ECPND Large Cap 50, equal weight | +17.8% | -21.4% | 0.91 |
| ECPND Large Cap 50 without NVDA | +17.6% | -22.3% | 0.90 |
The 200 largest companies at capitalisation weights stay close to SPY (+13.4% against +12.2%); the difference is the larger members outpacing the smaller ones in this period. Selecting the 50 weakest ECPND scores instead of the strongest returned +11.0%, so the score separates the two halves by 9 points per year. Equal weights lose 2 points; leaving NVDA out of the large-cap set loses 2 points.
Table 3 separates the parts of the result. Holding the 200 largest companies at capitalisation weights stays within about a point of SPY per year, which confirms the share counts and prices and shows how little the largest members alone gained over the whole index. Selecting the 50 weakest scores instead of the strongest returned +11.0% per year, below the index; the score orders the large caps in the right direction, and the spread between its two ends is 9 points per year. Capitalisation weighting matters: the same 50 stocks at equal weight returned +17.8% and were ahead of SPY in far fewer one-year windows. The result also does not rest on one stock. With NVIDIA removed from the large-cap set before selection, the portfolio still returned +17.6% per year, 5 points above SPY.
04Limits
The lead over SPY is not evenly spread. In rolling one-year windows the selection was ahead in 83% of cases and at worst -9 points behind. The year 2023 shows what a bad stretch looks like: the account stood in energy, consumer and health care stocks while the market was carried by a handful of technology companies, and it finished 11 points behind the index. An investor who adopted the selection at the start of 2023 would have waited about 14 months to draw level with SPY. The tracking error against SPY was 10% per year, about two thirds of that of the volatile-stock selection, but far from an index fund.
The construction was chosen in hindsight. The number of large companies, the number of holdings and the cap were fixed after reviewing variants on the same history: with the 150 largest companies instead of 200 the return falls by 4 points per year, with the 100 largest by 5 points, while 40 or 60 holdings and caps between 10% and 20% change it by at most 1.1 points. These are degrees of freedom that a single history cannot settle, and the sensitivity to the size of the large-cap set is the most important of them.
The period covers one market cycle, in which large technology companies led the market for most of the time and capitalisation weighting rewarded whoever held them. The score placed the selection there from 2024 on, but it had placed it elsewhere in 2022 and 2023, with mixed results. The accounts assume execution at the next open, costs of 10 bp and no market impact; at the size of these companies capacity is not a constraint, but taxes are not modelled. Delisted and acquired companies are missing from the universe, which flatters all portfolios including the index replica, although the comparison with SPY uses the fund's actual prices. This note is a historical simulation and not a forward test; a forward record for this construction is being set up alongside the existing ECPND forward test.