01Introduction
Who takes part in an earnings call is information in itself. External analysts decide which companies they follow and question, and because the same analysts recur across companies and quarters, their participation links companies into a network of professional attention. Earnings Call Participation Network and Dynamics (ECPND) measures the structure of this network and the way its connections form, persist and shift over time, and expresses the result as a daily score for US stocks. Our published study examines the score as an overlay on stock rankings; the Large Cap 50 note builds an S&P 500 alternative from it.
Many investors do not hold the S&P 500 but the MSCI World, which adds Europe, Japan and the other developed markets to the US. The score covers only US companies, because it is built from US earnings calls. This note asks what the score is worth to a World investor: it keeps the foreign part of the index unchanged and applies the selection to the US part alone. The result is a portfolio that holds the same regions at the same weights as the index, and differs from it only in which US companies it holds.
02Construction
The experiment follows a single account from 10 January 2022 to 18 September 2026. Every quarter it repeats the same three steps, 19 times in total.
- Split the account. 70% of the account is assigned to US equities and 30% to developed markets outside North America. The US share is the long-run weight of the United States in the MSCI World index over the tested period; it is held fixed rather than read from the index each quarter, so that the result does not depend on index data we do not freeze.
- Select the US part. The US share is invested in the ECPND Large Cap 50 selection exactly as published: among the 200 largest US companies of the study universe, the 50 with the highest ECPND score on the decision day, weighted by market capitalisation, scaled to the sector weights of the large-cap set, with no stock above 15%. The score decides which companies are held; the index decides the sector weights.
- Hold the foreign part and trade. The foreign share is invested in IEFA, the iShares Core MSCI EAFE fund, which covers developed markets in Europe, Australasia and the Far East. At the next market open the account sells what is no longer selected, buys what is new and restores the 70/30 split. Until the next quarter nothing is traded, and the two parts drift with their prices.
The account starts with $1 million, keeps 95% invested and 5% in cash, and pays 10 bp on the value of every purchase and every sale. The comparison is URTH, the iShares MSCI World fund, bought once at the open of the first day and held to the end with the same invested share and the same costs. All prices are adjusted for splits and dividends. A control account holds SPY instead of the selection with the same split and the same rebalancing; it shows how closely two funds reproduce the index, and isolates the selection as the only difference.
03Results
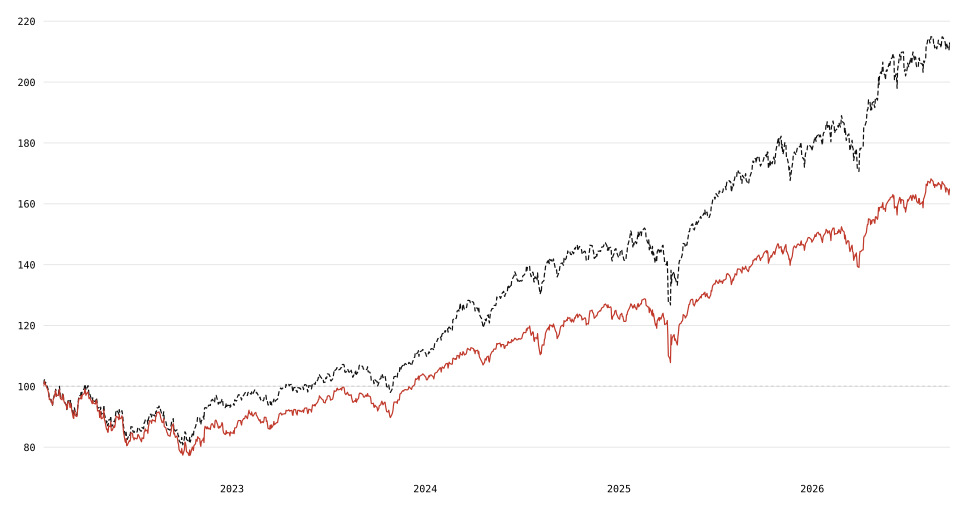
Figure 1 follows $100 in each account. ECPND World was ahead of URTH on 99% of all trading days since the start. The lead opened in 2022, when the US selection fell less than the US market, and widened in 2024 and 2026. Measured against its own best relative level, the account fell at most 5% behind URTH, in December 2025. Over the first half of the period ECPND World returned +10.5% per year against +5.2% for URTH; over the second half +24.3% against +17.4%.
| Portfolio | Return p.a. | Total return | Largest loss | Volatility | Sharpe |
|---|---|---|---|---|---|
| ECPND World | +17.4% | +112% | -21.1% | 16.8% | 1.04 |
| URTH, buy & hold | +11.2% | +65% | -24.0% | 15.7% | 0.75 |
ECPND World returned +17.4% per year against +11.2% for URTH, with a largest loss of -21.1% against -24.0% and volatility of 16.8% against 15.7%.
| Portfolio | 2022 | 2023 | 2024 | 2025 | 2026 to Sep |
|---|---|---|---|---|---|
| ECPND World | -6.5% | +19.6% | +27.3% | +24.6% | +19.6% |
| URTH, buy & hold | -15.3% | +22.6% | +17.8% | +20.5% | +11.6% |
ECPND World finished ahead of URTH in 2022, 2024, 2025 and 2026 and behind it in 2023, by 3 points.
| Portfolio | Return p.a. | Largest loss | Sharpe |
|---|---|---|---|
| Control: SPY and IEFA | +11.3% | -24.0% | 0.76 |
| ECPND World without sector scaling | +16.9% | -24.9% | 0.92 |
| ECPND Large Cap 50 alone | +20.9% | -19.9% | 1.11 |
| IEFA, buy & hold | +9.2% | -27.8% | 0.63 |
The control, 70% SPY and 30% IEFA rebalanced quarterly, returned +11.3% against +11.2% for URTH with a tracking error of 1.1%, so the two-fund mix reproduces the index. Replacing SPY with the ECPND selection is the only change in ECPND World. Without the sector scaling of the US sleeve the account returned +16.9% with a largest loss of -24.9%. The selection alone returned +20.9% and IEFA alone +9.2%.
Table 3 shows where the result comes from. The control account, which holds SPY in place of the selection, returns +11.3% against +11.2% for URTH, with a tracking error of 1.1% per year: two funds at a fixed 70/30 split reproduce the World index closely enough for this comparison. ECPND World differs from that control in one respect, the US fund is replaced by the selection, and that one change accounts for the whole gap of 6 points per year. The US share matters in the way one would expect: with 60% in the selection the account returned +16.2% per year, with 80% +18.6%. The foreign part, IEFA, returned +9.2% on its own over the period, well below the US market, which is why the selection's lead over URTH is smaller than its lead over SPY.
04Limits
Everything that limits the Large Cap 50 note limits this one, because the US sleeve is that account. The tested period covers one market cycle of less than five years in which US large technology companies led the world; the construction was fixed after reviewing variants on the same history; delisted companies are missing from the US universe; and the score has not been tested on data it had not seen. The Limits section of that note gives the measurements. In rolling one-year windows ECPND World was ahead of URTH in 96% of cases and at worst -3 points behind, with a tracking error of 5% per year.
Two limits belong to this note alone. The US weight of 70% is a round figure for a share that moved between the mid sixties and low seventies over the period; the control shows that the simplification costs little, but a product that tracks the index would read the weight from it. And the foreign part is a fund, not a selection: the score says nothing about European or Japanese companies, so an investor who holds this portfolio should expect the index return on three tenths of it and the selection's behaviour on the rest. This note is a historical simulation and not a forward test.