01The portfolio opportunity
The useful question is whether a company's change in outlook can improve the use of capital already invested in the equity market. The approach keeps a SPY position as its foundation, reallocates part of that capital when a qualifying EPS revision appears, and restores the market position after the event trade ends. This gives the earnings observation a specific role within an otherwise invested account.
The economic hypothesis is that an unusually strong revision may identify a more substantial improvement in the company's outlook than a routine increase. Comparing each revision with the same company's earlier revisions provides context for differences in guidance practices. The research then tests whether that distinction can support a practical portfolio decision.
Table 1Three funded accounts under the same cost assumption
| Account | Total return | CAGR | Max. drawdown | Sharpe | Difference, pp |
|---|---|---|---|---|---|
| SPY control | +71.53% | 12.20% | -22.29% | 0.78 | +0.00 |
| SPY + EPS, 5/58 | +76.29% | 12.86% | -20.93% | 0.82 | +4.75 |
| SPY + EPS, 10/58 | +87.06% | 14.29% | -20.36% | 0.89 | +15.52 |
Every account begins with USD 100,000. Total return covers the entire study window; the difference column is in percentage points over that window. CAGR expresses annualized growth. Maximum drawdown is measured from daily account values. Sharpe uses daily returns, annualized with 252 sessions, without subtracting a risk-free rate. The SPY control initially invests 95% of capital and retains residual cash.
The 10/58 account ends at USD 187,058.36, a +15.52 percentage-point total-return advantage over the control. Its average equity exposure is 95.65%, compared with 95.64% for SPY. The improvement therefore occurs with similar average equity exposure. The original 5/58 account provides a second, fixed reference throughout the timing investigation.
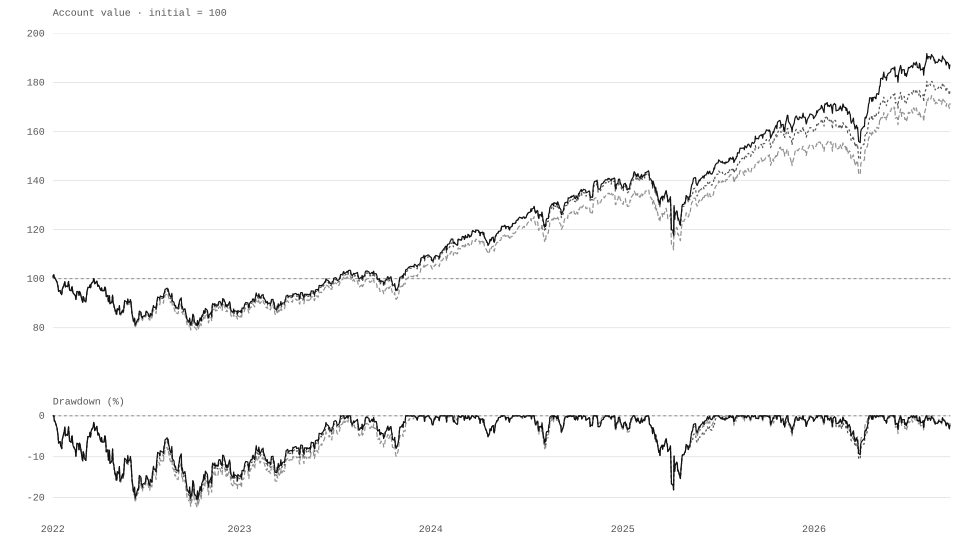
Account values are indexed to initial capital of 100. The lower panel shows each account's decline from its own preceding peak. Both panels use the saved daily ledgers after costs.
02From an EPS revision to a selected event
EPS means earnings per share. The source process extracts current and prior full-year guidance ranges, retaining the fiscal period and accounting labels. The revision is the change in the range midpoint divided by the absolute previous midpoint. A zero previous midpoint cannot support this calculation.
The selection rule has four steps:
- Keep comparable observations. Match current and prior guidance within the same structured accounting and measurement definition. Maintain separate histories for different accounting, share-basis, currency and scope labels.
- Choose one observation per issuer and call date. Prefer non-GAAP, then GAAP, then IFRS; within that order prefer diluted, basic, then unspecified share basis. Conflicting equally preferred observations lead to abstention. Selection precedes the history calculation.
- Measure the revision against its own history. Require at least three earlier observations in the same stream during the preceding 1,095 calendar days. Rank the new revision using the fraction of earlier revisions below it, plus half the fraction tied with it.
- Retain unusual increases. Require a positive revision greater than the numerical tolerance of 10⁻⁸ and a historical midrank of at least 0.75. Insufficient history leaves the event ineligible.
The canonical source ledger contains 142 events and yields 127 selected issuer-date observations across all available dates. Within the strategy's call-date window, 104 observations remain, 47 have sufficient prior history and 30 have positive revisions. The unusual-revision rule selects 20 events from eight companies. Their distribution is AKAM: 4; CDNS: 1; CVS: 5; DGX: 2; GEN: 1; MO: 2; TDY: 2; WST: 3.
The source history includes valid earlier observations even when they were not selected for a trade. Current and prior guidance within an event must refer to the same fiscal year; the historical rank may use comparable revisions from earlier fiscal years. Unknown metadata remain explicitly unknown. The source and event-selection rules remain identical across the allocation and timing studies.
This is a separate EPS-guidance research strategy. It does not use the ECPND participation score or ECQDI text factor to select holdings.
03A fully funded trading rule
The portfolio starts with 95% of USD 100,000 in SPY. At 10 bp purchase cost, USD 4,905 remains as the initial nominal cash reserve. Subsequent event positions are financed by selling SPY; no leverage or new capital is introduced.
- Position size. Each new EPS purchase targets at most 9.5% of the preceding close's account value, capped by available ETF funding after fees. This is a per-entry limit, not a fixed aggregate EPS allocation. All entries at the same opening use the same preceding-close account value.
- Entry timing. The first US trading session strictly after the call date is session zero. Under 10/58, ten complete sessions elapse before buying at the opening of session ten. The original rule buys at session five.
- Exit timing. Hold for 58 trading sessions, counting the entry day as the first, and sell at the final session's close. No stop-loss, momentum, sector or volatility-selection filter changes this schedule.
- Funding and reinvestment. A same-opening SPY sale funds the stock purchase and both transaction fees. Net proceeds from an EPS closing sale are reinvested in SPY at the next opening. The initial cash reserve remains untouched.
- Overlapping events. Allow at most ten EPS positions and no second position in an already held issuer. A later event for that issuer is skipped, without extending the holding period or queuing another entry. Simultaneous candidates are ordered by historical rank, revision magnitude and ticker.
- Prices and accounting. Use fractional adjusted units, adjusted opens for entry and adjusted closes for exits and daily valuation. Corporate actions are represented in the adjusted series. Charge 10 bp on every executed buy and sell, including ETF rotations; cash earns no interest. Open positions remain marked at the study cut-off without a forced sale.
An unavailable entry opening price results in a recorded skip. Missing required prices for an existing holding make the account unresolved rather than silently filling a price. Retained quantities do not undergo a daily weight reset. The ten-session candidate's mean EPS exposure is 9.02%; actual exposure varies as events arrive, prices move and positions expire.
04Timing and consistency across years
The timing grid combines waiting periods of 3, 5 and 10 complete sessions with holding periods of 42, 58 and 84 sessions. All variants use the same original 20-event set, source definition, funding mechanics and 10 bp costs. The 10/58 combination has the highest total return and Sharpe in this grid, with the smallest maximum drawdown.
Table 2Calendar-year returns from the continuous accounts
| Year | SPY | EPS 5/58 | EPS 10/58 | 10/58 difference, pp |
|---|---|---|---|---|
| 2022 (partial) | -15.30% | -13.81% | -13.18% | +2.12 |
| 2023 | +24.66% | +25.90% | +25.87% | +1.21 |
| 2024 | +23.73% | +25.39% | +25.61% | +1.88 |
| 2025 | +17.05% | +17.43% | +20.40% | +3.35 |
| 2026 (partial) | +12.17% | +10.33% | +13.19% | +1.02 |
2022 begins on 10 January; 2026 ends on 18 September. These are returns of funded accounts, including transaction costs. The 10/58 variant exceeds SPY in all five reported year segments. The original 5/58 rule improves four of the five.
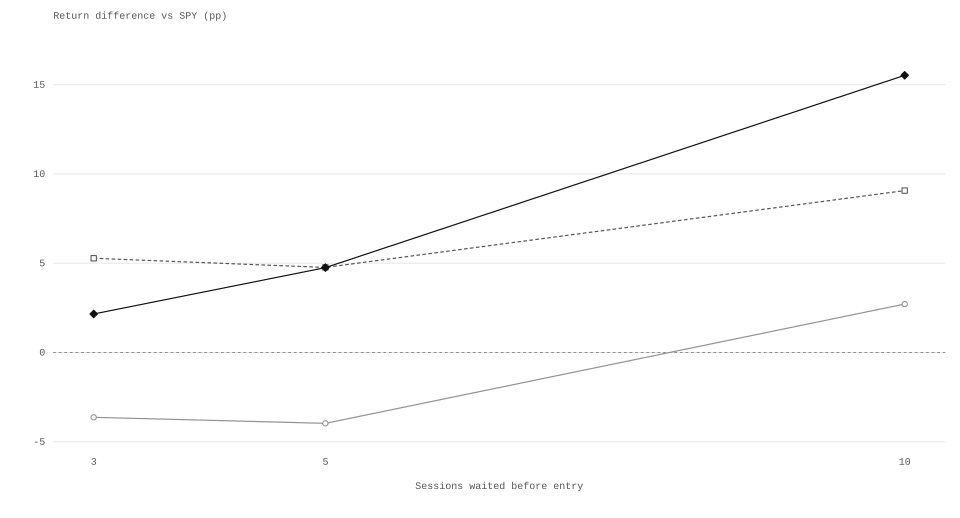
Each point shows the full-window total-return difference from the same SPY control. Lines connect tested settings; intermediate timings were not simulated.
Table 3The complete timing grid
| Wait / hold, sessions | Total return | Difference, pp | Max. drawdown | Sharpe | EPS entries |
|---|---|---|---|---|---|
| 3 / 42 | +67.90% | -3.63 | -21.77% | 0.75 | 20 |
| 3 / 58 | +73.69% | +2.16 | -21.33% | 0.80 | 20 |
| 3 / 84 | +76.81% | +5.28 | -21.15% | 0.82 | 16 |
| 5 / 42 | +67.56% | -3.97 | -21.63% | 0.75 | 20 |
| 5 / 58 | +76.29% | +4.75 | -20.93% | 0.82 | 20 |
| 5 / 84 | +76.30% | +4.76 | -20.75% | 0.82 | 16 |
| 10 / 42 | +74.25% | +2.71 | -21.09% | 0.80 | 20 |
| 10 / 58 | +87.06% | +15.52 | -20.36% | 0.89 | 20 |
| 10 / 84 | +80.60% | +9.07 | -20.78% | 0.85 | 16 |
Seven combinations finish ahead of SPY, and all nine have shallower maximum drawdowns. Waiting ten sessions produces positive total-return differences at all three tested holding periods. The two shorter-wait, 42-session settings finish below SPY. Holding for 84 sessions blocks four subsequent entries in each variant because the issuer is already held, reducing the number of purchases from 20 to 16.
Changing the waiting period moves both entry and exit dates because the holding period starts at entry. The grid therefore evaluates complete trading schedules. It does not isolate an entry-delay effect at an unchanged exit date.
05Allocation and trading-cost sensitivity
The allocation study compares fixed entry sizes with a volatility-scaled alternative under the original 5/58 timing. Before entry, the latter measures 63 daily returns through the preceding close and multiplies the position target by the smaller of one and SPY volatility divided by stock volatility. More volatile stocks receive smaller positions; quantities remain fixed after entry.
Table 4Two ways to fund the original EPS overlay
| Account, 5/58 timing | Total return | Max. drawdown | Sharpe | Mean equity exposure |
|---|---|---|---|---|
| SPY control | +71.53% | -22.29% | 0.78 | 95.64% |
| SPY + EPS, fixed entry size | +76.29% | -20.93% | 0.82 | 95.60% |
| SPY + EPS, volatility-scaled size | +72.77% | -21.55% | 0.79 | 95.61% |
Both implementations finish above their SPY control with lower maximum drawdown. Fixed sizing produces the larger return contribution and higher Sharpe, making it the more promising allocation for the subsequent timing comparison. The volatility rule is a sizing adjustment, distinct from a volatility filter used to select a stock universe.
The broader size and cost study varies the original fixed entry target from 2.5% to 9.5%, and recomputes both the overlay and its control at each transaction-cost assumption.
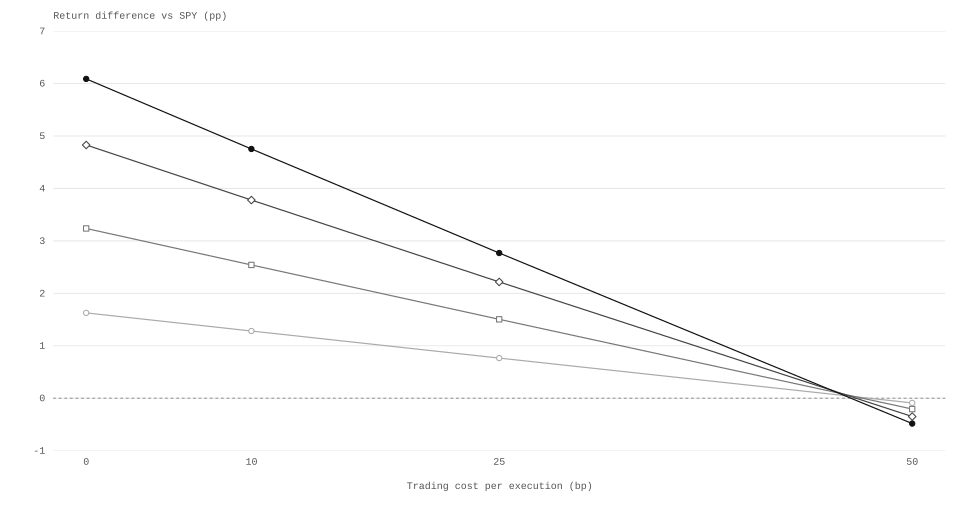
All four entry sizes retain positive contributions at 0, 10 and 25 bp per trade. Larger allocations produce larger historical contributions within this tested range. The plot includes the 50 bp outcomes and uses a separate cost-matched control at each fee level.
Table 5Total-return difference from SPY in percentage points
| New-entry target | 0 bp cost | 10 bp cost | 25 bp cost | 50 bp cost |
|---|---|---|---|---|
| 2.5% | +1.63 | +1.28 | +0.76 | -0.09 |
| 5% | +3.24 | +2.54 | +1.50 | -0.21 |
| 7.5% | +4.83 | +3.78 | +2.22 | -0.35 |
| 9.5% | +6.09 | +4.75 | +2.77 | -0.48 |
Each cell uses the original five-session wait and 58-session holding period. The separate timing grid uses 9.5% entries and 10 bp costs. These are two distinct comparisons, not a full cross-product of every size, cost and timing choice.
For context, the initial investigation also funded the event trades from cash. It compared EPS purchases with SPY purchases made on the same accepted entry and exit dates, using each account's own capital.
Table 6Event accounts funded from cash
| Account | Total return | Max. drawdown | Sharpe | Mean equity exposure |
|---|---|---|---|---|
| Unusual EPS raises | +14.29% | -3.43% | 1.07 | 9.12% |
| Unusual EPS raises, volatility-scaled | +7.20% | -1.64% | 1.03 | 4.90% |
| SPY at the same entry/exit dates | +10.35% | -1.45% | 1.26 | 9.15% |
| SPY with matched size multipliers | +5.98% | -0.77% | 1.36 | 4.93% |
Fixed-size unusual EPS trades produce a higher total return than the corresponding event-timed SPY account. Their sparse deployment leaves most capital in cash, explaining why the continuously invested ETF overlay became the central application. The volatility-scaled cash version reduces drawdown and capital exposure together. Full results for the initial all-positive-EPS and momentum comparisons are retained in Appendix A.
06Proposed prospective evaluation
The next research candidate is the 10/58 EPS overlay with a 9.5% per-entry target, accompanied by the original 5/58 overlay and a SPY control. Running these three fixed accounts side by side would test the practical value of the timing choice while retaining the earlier benchmark.
Before the first prospective decision, fix the event definition, account funding, timing, fees and missing-data rules under a version identifier. Record the actual time each source observation arrives, the accepted guidance fields, the historical rank and the scheduled trade. Preserve corrections as later records, together with every skipped event and its reason. Track monthly returns, drawdowns, costs and the contribution relative to SPY from the first actual observation onward.
Source review should establish the fiscal period, accounting basis, currency, share basis and scope before accepting a new event. This stronger completeness requirement would define a new prospective data version, whose coverage must be reported separately from the historical sample. An internal ledger should retain adjusted-price and corporate-action accounting alongside any later broker-paper implementation.
This is a proposed evaluation design. The EPS strategy has not yet been connected to a live event pipeline or activated in a forward-trading account.
07Limitations
- Selection and uncertainty. The 20 events are a small, previously researched sample, and 10/58 was highlighted after comparing timings. Its Sharpe-difference interval is [+0.009, +0.236], with nominal p = 0.049 and Holm-adjusted p = 0.441 across nine comparisons. No tested comparison family establishes significance after its Holm correction; the full research search is not adjusted.
- Concentration and costs. Under the original 5/58 rule, excluding CDNS and TDY together changes the advantage to -1.93 pp; this joint omission has not been tested at 10/58. All original-rule size variants underperform at 50 bp costs. Lower maximum drawdown does not guarantee a better worst month.
- Source quality. All 20 events have incompletely specified currency and scope; 11 also lack explicit EPS share basis. Original publication times are not fully verified, and a call may repeat an earlier announcement. This is a provisional extracted sample, not complete market coverage.
- Scope. Flat fees do not separately model spreads or market impact. Calendar segments share the same history; bootstrap intervals resample fixed account returns. The results do not establish independent alpha or future profitability. This is research, not investment advice.
AAppendix A and reproducible evidence
The note draws on four frozen studies: the initial funded strategy, allocation comparison, size/cost robustness and timing grid. A local export contains all 53 study-account summaries, including repeated controls and reproduced variants, with study identifiers retained. These rows are not 53 independent strategies. Account summaries, paired comparisons, all stored inference results, timing-study monthly returns and annual returns accompany the note.
Company omission checks
The original 5/58 overlay remains ahead of SPY after each single-company omission. The combined CDNS/TDY check is retained alongside those eight tests. When an event is removed, its capital stays in SPY; no replacement stock is selected.
Table A1Original 5/58 overlay after issuer exclusions
| Omitted issuer | EPS entries | Total return | Difference, pp | Max. drawdown |
|---|---|---|---|---|
| AKAM | 16 | +74.78% | +3.24 | -20.93% |
| CDNS | 19 | +73.15% | +1.62 | -22.29% |
| CVS | 15 | +79.30% | +7.76 | -20.93% |
| DGX | 18 | +74.73% | +3.20 | -20.93% |
| GEN | 19 | +79.85% | +8.32 | -20.93% |
| MO | 18 | +76.54% | +5.01 | -20.93% |
| TDY | 18 | +72.68% | +1.15 | -20.93% |
| WST | 17 | +74.63% | +3.10 | -20.93% |
| CDNS + TDY | 17 | +69.61% | -1.93 | -22.29% |
The unchanged original overlay returns +76.29%, compared with +71.53% for SPY. Exclusions are diagnostics chosen after observing the history, not portfolio rules. The difference column measures each remaining account against SPY.
Timing inference
The timing comparison uses 5,000 shared circular-block resamples of aligned daily returns, with blocks of 63 trading sessions. Sharpe differences are recalculated for each resample; the centered two-sided p-values receive Holm correction across the nine timing comparisons. Account states are not re-traded inside the bootstrap. The fixed block length may leave dependence beyond 63 sessions, including in the 84-session strategies.
Table A2All nine timing comparisons against SPY
| Wait / hold | Sharpe difference | 95% interval | p | Holm p |
|---|---|---|---|---|
| 03 / 042 | -0.026 | [-0.115, +0.067] | 0.582 | 1.000 |
| 03 / 058 | +0.019 | [-0.084, +0.127] | 0.719 | 1.000 |
| 03 / 084 | +0.040 | [-0.103, +0.206] | 0.600 | 1.000 |
| 05 / 042 | -0.028 | [-0.117, +0.064] | 0.543 | 1.000 |
| 05 / 058 | +0.039 | [-0.074, +0.164] | 0.509 | 1.000 |
| 05 / 084 | +0.037 | [-0.109, +0.200] | 0.637 | 1.000 |
| 10 / 042 | +0.021 | [-0.047, +0.092] | 0.541 | 1.000 |
| 10 / 058 | +0.114 | [+0.009, +0.236] | 0.049 | 0.441 |
| 10 / 084 | +0.068 | [-0.078, +0.219] | 0.358 | 1.000 |
The earlier allocation study applies Holm within four Sharpe comparisons, and the size/cost study within 16. The initial funded study tests three annualized arithmetic daily-return differences, rather than Sharpe or CAGR differences. Those separate families, their saved intervals and p-values are retained in inference.csv. Different fixed bootstrap seeds across studies explain small interval differences for reproduced accounts.
Original funded accounts
Table A3All five original strategy accounts
| Original account | Total return | CAGR | Max. drawdown | Mean equity exposure |
|---|---|---|---|---|
| Unusual EPS raises | +14.29% | 2.89% | -3.43% | 9.12% |
| All positive EPS raises | +12.71% | 2.59% | -6.24% | 13.71% |
| Monthly 63-session momentum | +3.80% | 0.80% | -18.27% | 85.30% |
| SPY control | +71.53% | 12.20% | -22.29% | 95.64% |
| SPY at EPS entry/exit dates | +10.35% | 2.12% | -1.45% | 9.15% |
The all-positive rule keeps the source and minimum-history requirements but removes the unusual-rank threshold. Momentum ranks positive prior 63-session price returns, monthly, within issuers already observed in the canonical EPS ledger before each decision. The SPY event account follows the accepted unusual-EPS entry/exit dates. Different equity exposures distinguish these accounts from risk-matched comparisons.
Verification and evidence versions
The four frozen studies record 29, 12, 11 and 12 targeted checks, respectively, and each has a separate internal ledger-reconciliation record. The largest recorded NAV discrepancy is below USD 1.2 × 10⁻¹⁰. These checks support arithmetic reproducibility; they are internal engineering checks, not external validation of the investment hypothesis.
Figures and tables are generated from saved study results. The underlying research records, source checksums and verification logs are retained internally.